
Alamosa River above Terrace Reservoir, CO
The Rio Grande Water Conservation District (RGWCD) works to protect water rights and promote efficient and sustainable water use within the San Luis Valley in south-central Colorado, in the upper portion of the Rio Grande basin. In 2005, after consultation with the RGWCD, Connie Woodhouse developed reconstructions for four gages (on the Rio Grande near Del Norte, Saguache Creek, Alamosa River, and Conejos River) which represent most of the surface water supply for the San Luis Valley.
Methods
A forward stepwise regression procedure was used to calibrate the observed flow record with a pool of potential predictors consisting of 15 tree-ring chronologies from Colorado and northern New Mexico. The residual chronologies, with the low-order autocorrelation removed, were used. Six predictor chronologies were selected by the stepwise procedure for the reconstruction model. Validation statistics were computed using a leave-one-out (cross-validation) approach.
Predictor Chronologies: Montrose (CO), Platt Bradbury (CO), Tres Piedras (NM), Wild Rose (CO), Natural Arch (CO) , Trail Gulch (CO)
| Statistic | Calibration | Validation |
| Explained variance (R2) | 0.80 | |
| Reduction of Error (RE) | 0.75 | |
| Standard Error of the Estimate | 13,600 AF | |
| Root Mean Square Error (RMSE) | 14,296 AF |
(For explanations of these statistics, see this document (PDF), and also the Reconstruction Case Study page.)

Figure 1. Scatterplot of observed and reconstructed Alamosa River annual flow, 1935-2002.
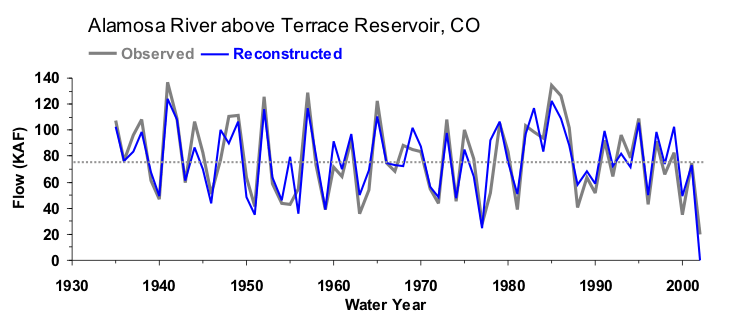
Figure 2. Observed (black) and reconstructed (blue) annual Alamosa River annual flow, 1935-2002. The observed mean is illustrated by the dashed line.
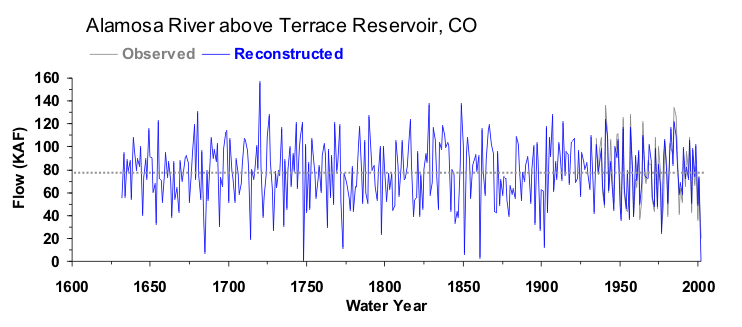
Figure 3. Reconstructed annual flow for the Alamosa River (1632-2002) is shown in blue. Observed flow is shown in gray and the long-term reconstructed mean is shown by the dashed line.
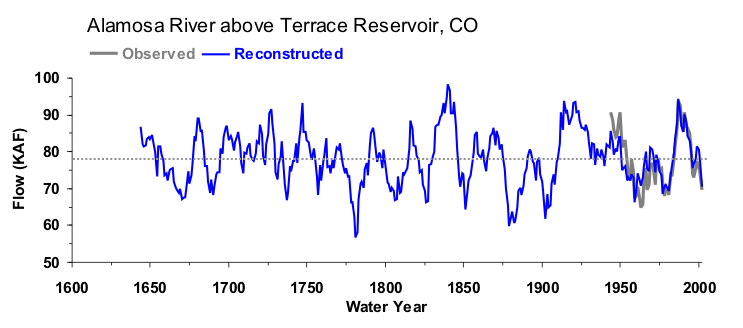
Figure 4. The 10-year running mean (plotted on final year) of reconstructed Alamosa River flow, 1632-2002. Reconstructed values are shown in blue and observed values are shown in gray. The long-term reconstructed mean is shown by the dashed line.

