
Arkansas River at Canon City, CO (update)
The original reconstruction for the Arkansas River at Cañon City was developed in collaboration with Colorado Springs Utilities in 2009. A small error in the estimation of the natural flows was identified by Jeff Lukas in 2010, who provide revised estimates for water years 1889-2002. The reconstruction model has been recalibrated, also taking advantage of updated tree-ring chronologies to extend the flow reconstruction to 2002.
Methods
A set of 25 standard chronologies made up the pool of candidate predictors for reconstruction model. Standard chronologies were used because the flow series contained low but statistically significant (p < 0.05) first order autocorrelation. A stepwise regression model was calibrated on the full gage record, resulted in a model with five predictors. Validation of the model was based on a leave-one-out cross validation strategy. The full reconstruction extended 1577-2002.
Predictor Chronologies: Trail Gulch Long (TRG), Pumphouse Long (PUM) (both Pinus edulis), and Sargents (SAR, Pseudotsuga menziesii) sites on the west slope of the Continental Divide, Natural Arch (ARC, Pinus edulis) in the upper Rio Grande basin, and Temple Canyon (TEM, Pinus edulis) in the Arkansas River drainage.
| Statistic | Calibration | Validation |
| Explained variance (R2) | 0.69 | |
| Reduction of Error (RE) | 0.66 | |
| Standard Error of the Estimate | 83,042 AF | |
| Root Mean Square Error (RMSE) | 85,609 AF |
(For explanations of these statistics, see this document (PDF), and also the Reconstruction Case Study page.)
*These statistics were calculated on the transformed flow values, and are unitless.
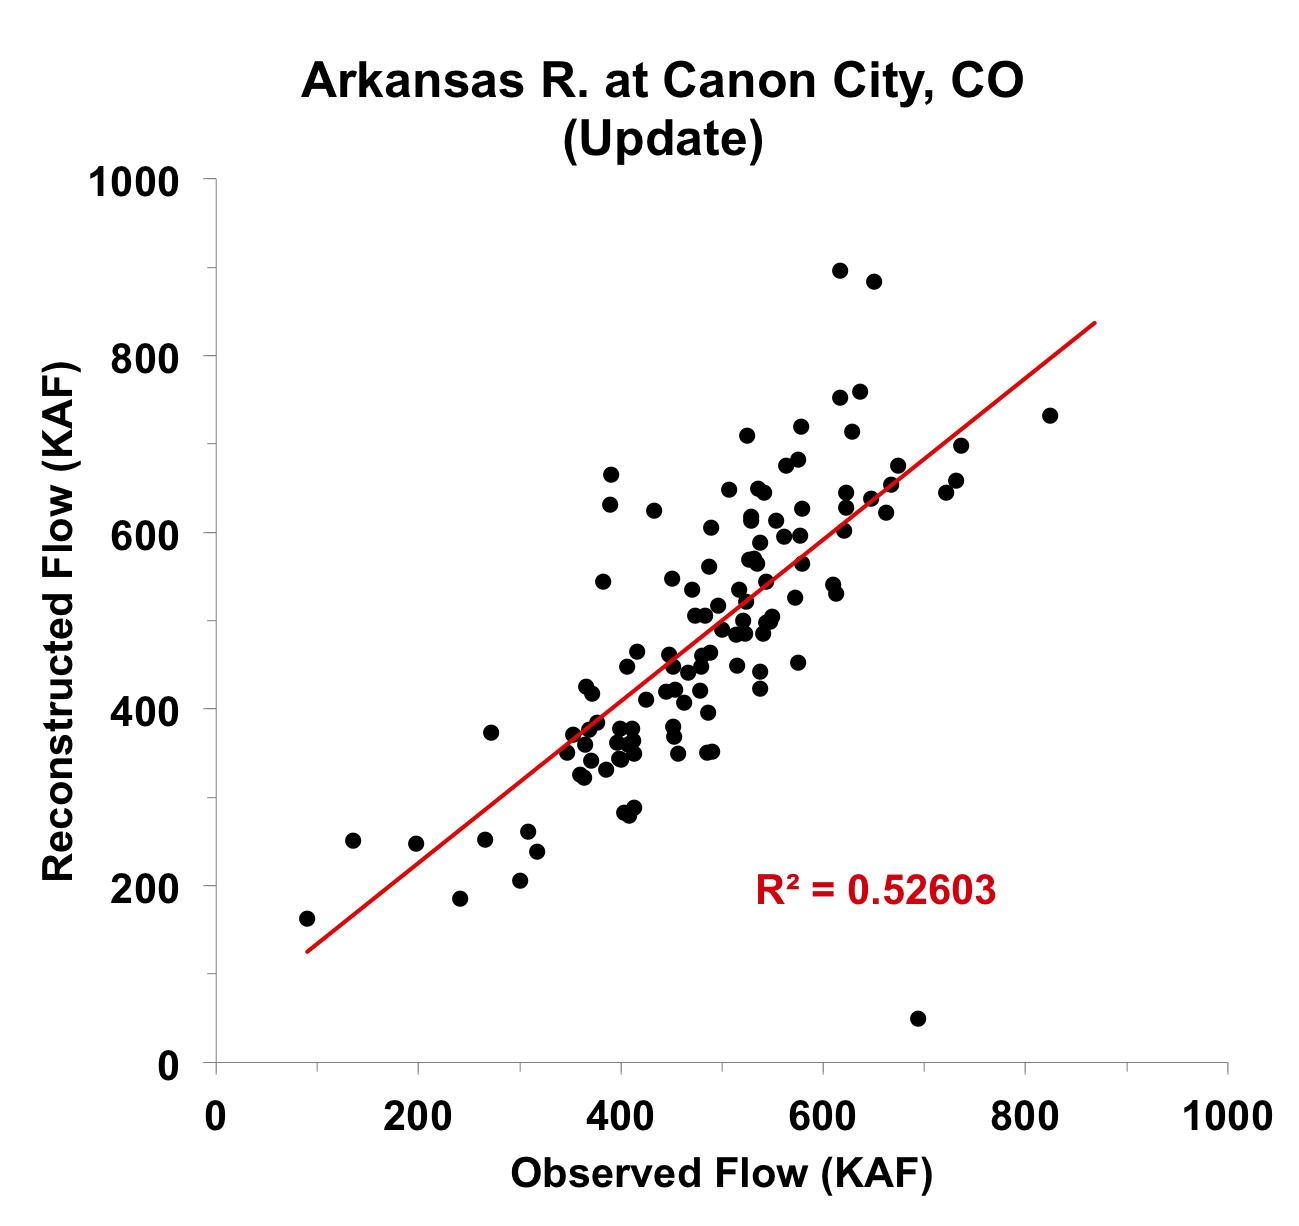
Figure 1. Scatter plot of observed and reconstructed Arkansas River annual flow, 1889-2003.
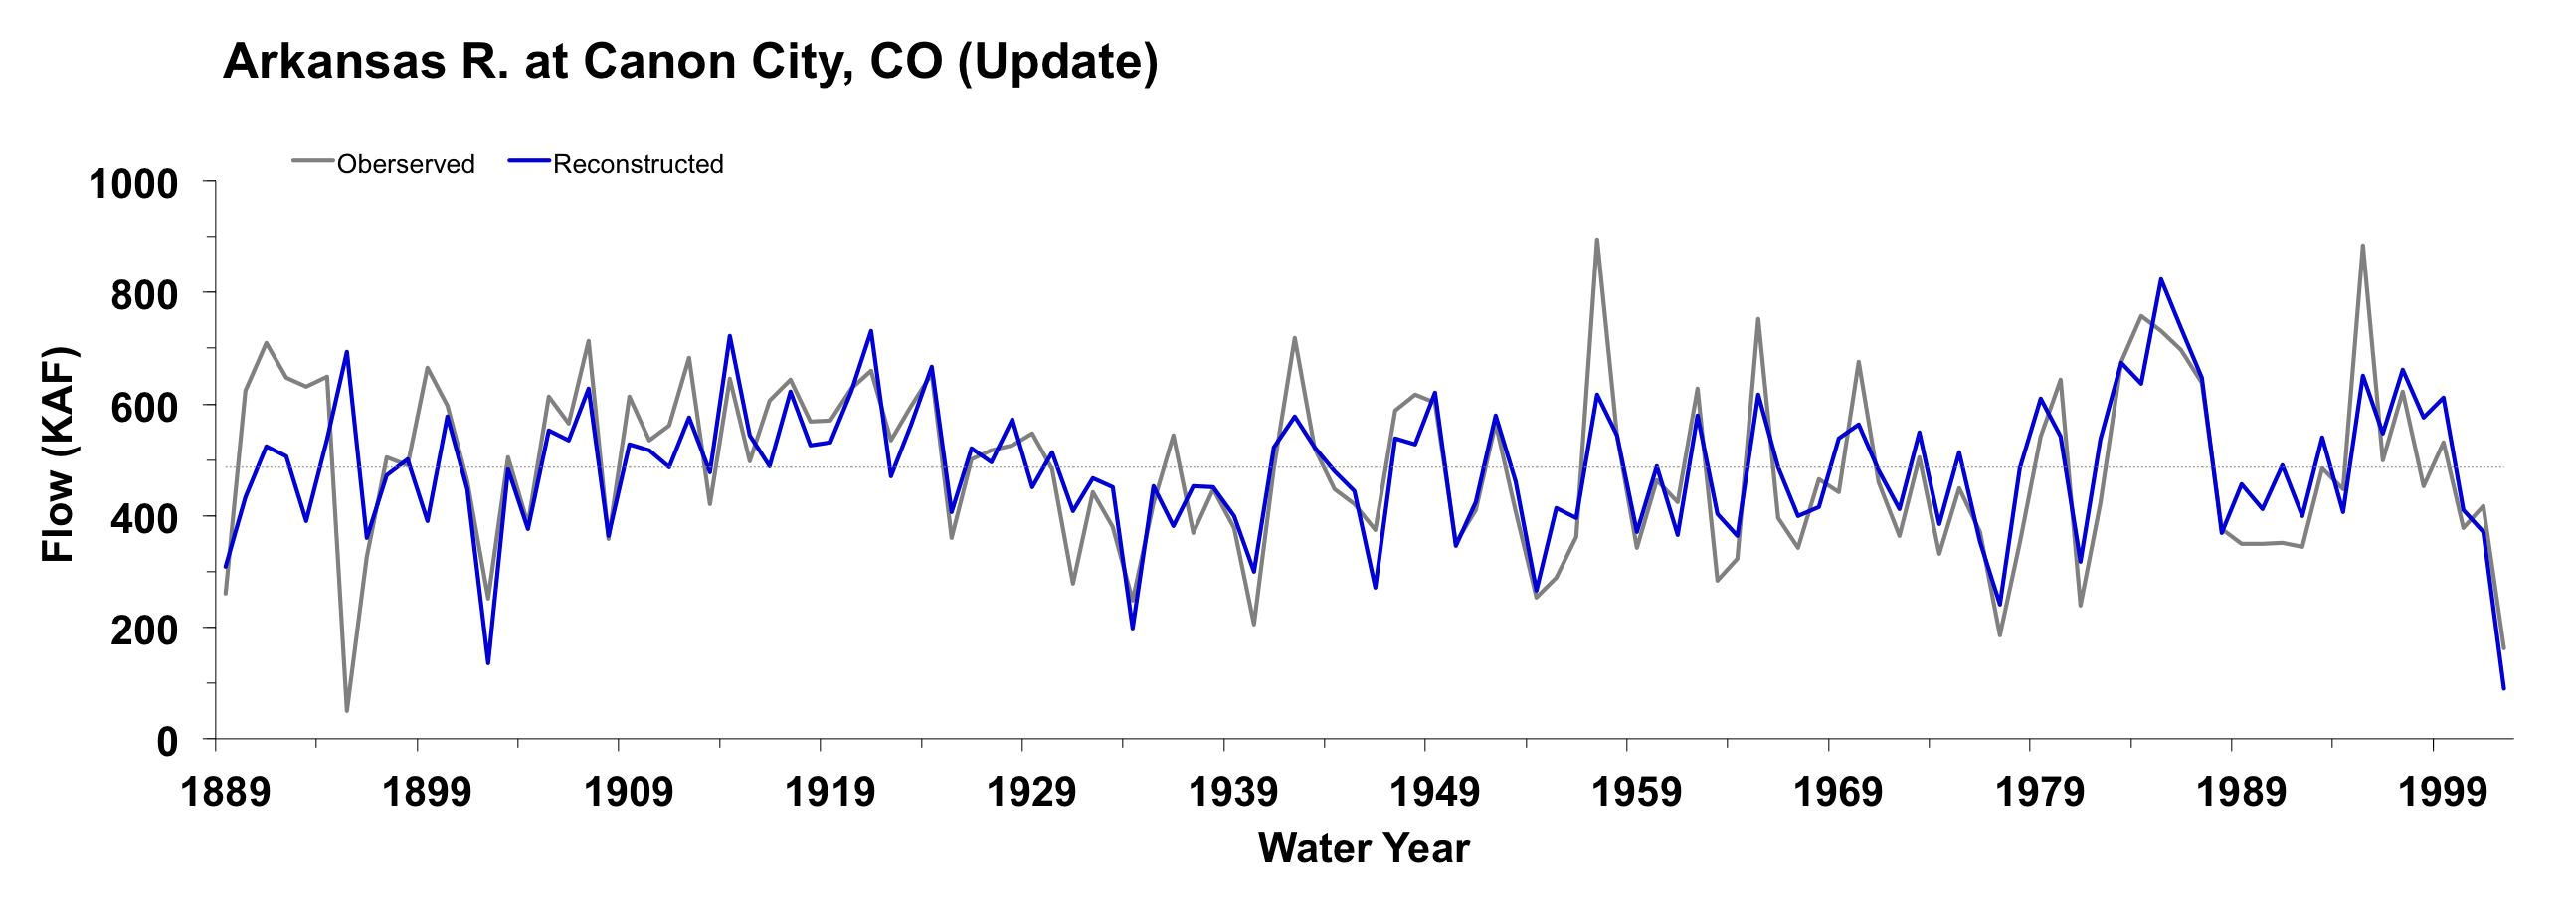
Figure 2. Observed (gray) and reconstructed (blue) Arkansas River annual flow, 1889-2003. The observed mean is illustrated by the dashed line.
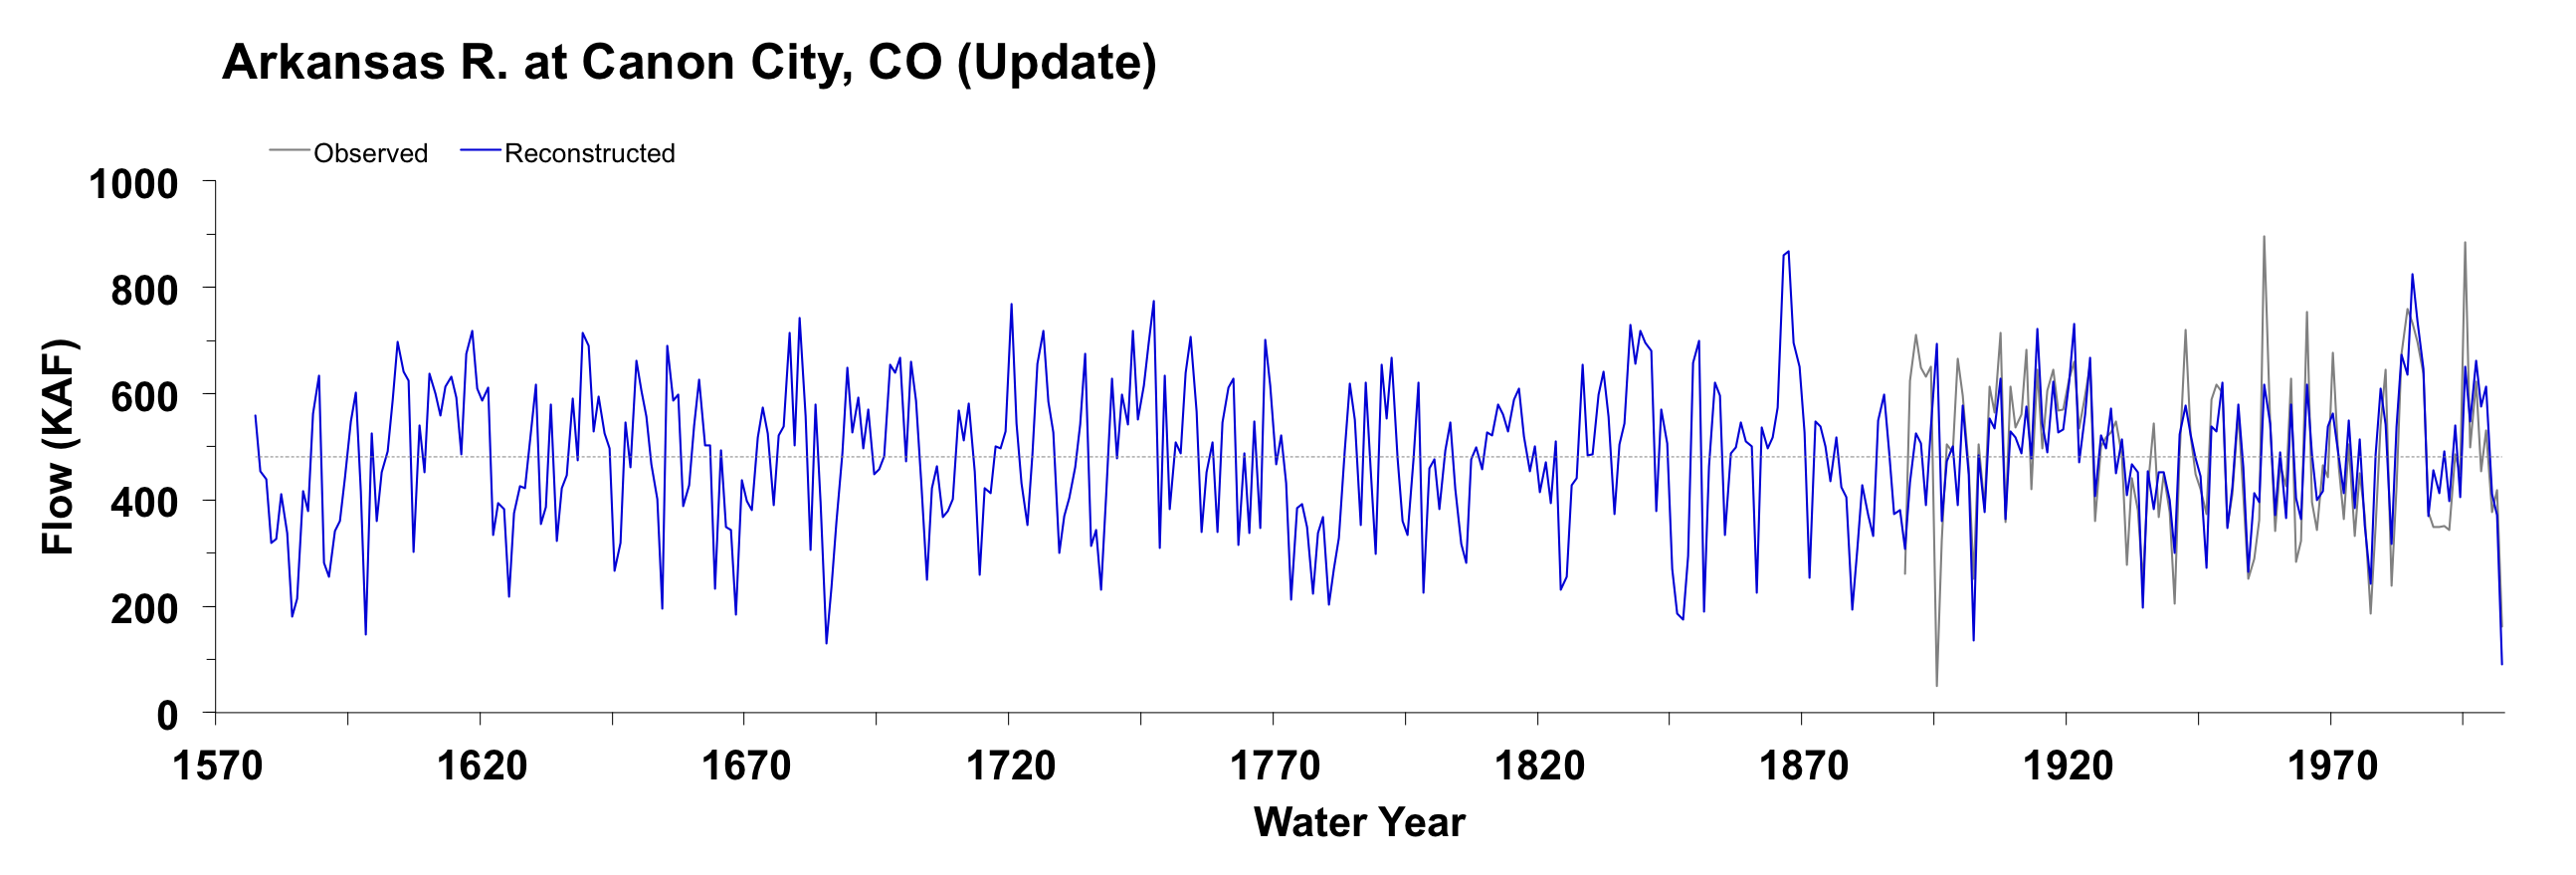
Figure 3. Reconstructed annual flow for the Arkansas River (1577-2002) is shown in blue. Observed flow is shown in gray and the long-term reconstructed mean is shown by the dashed line.
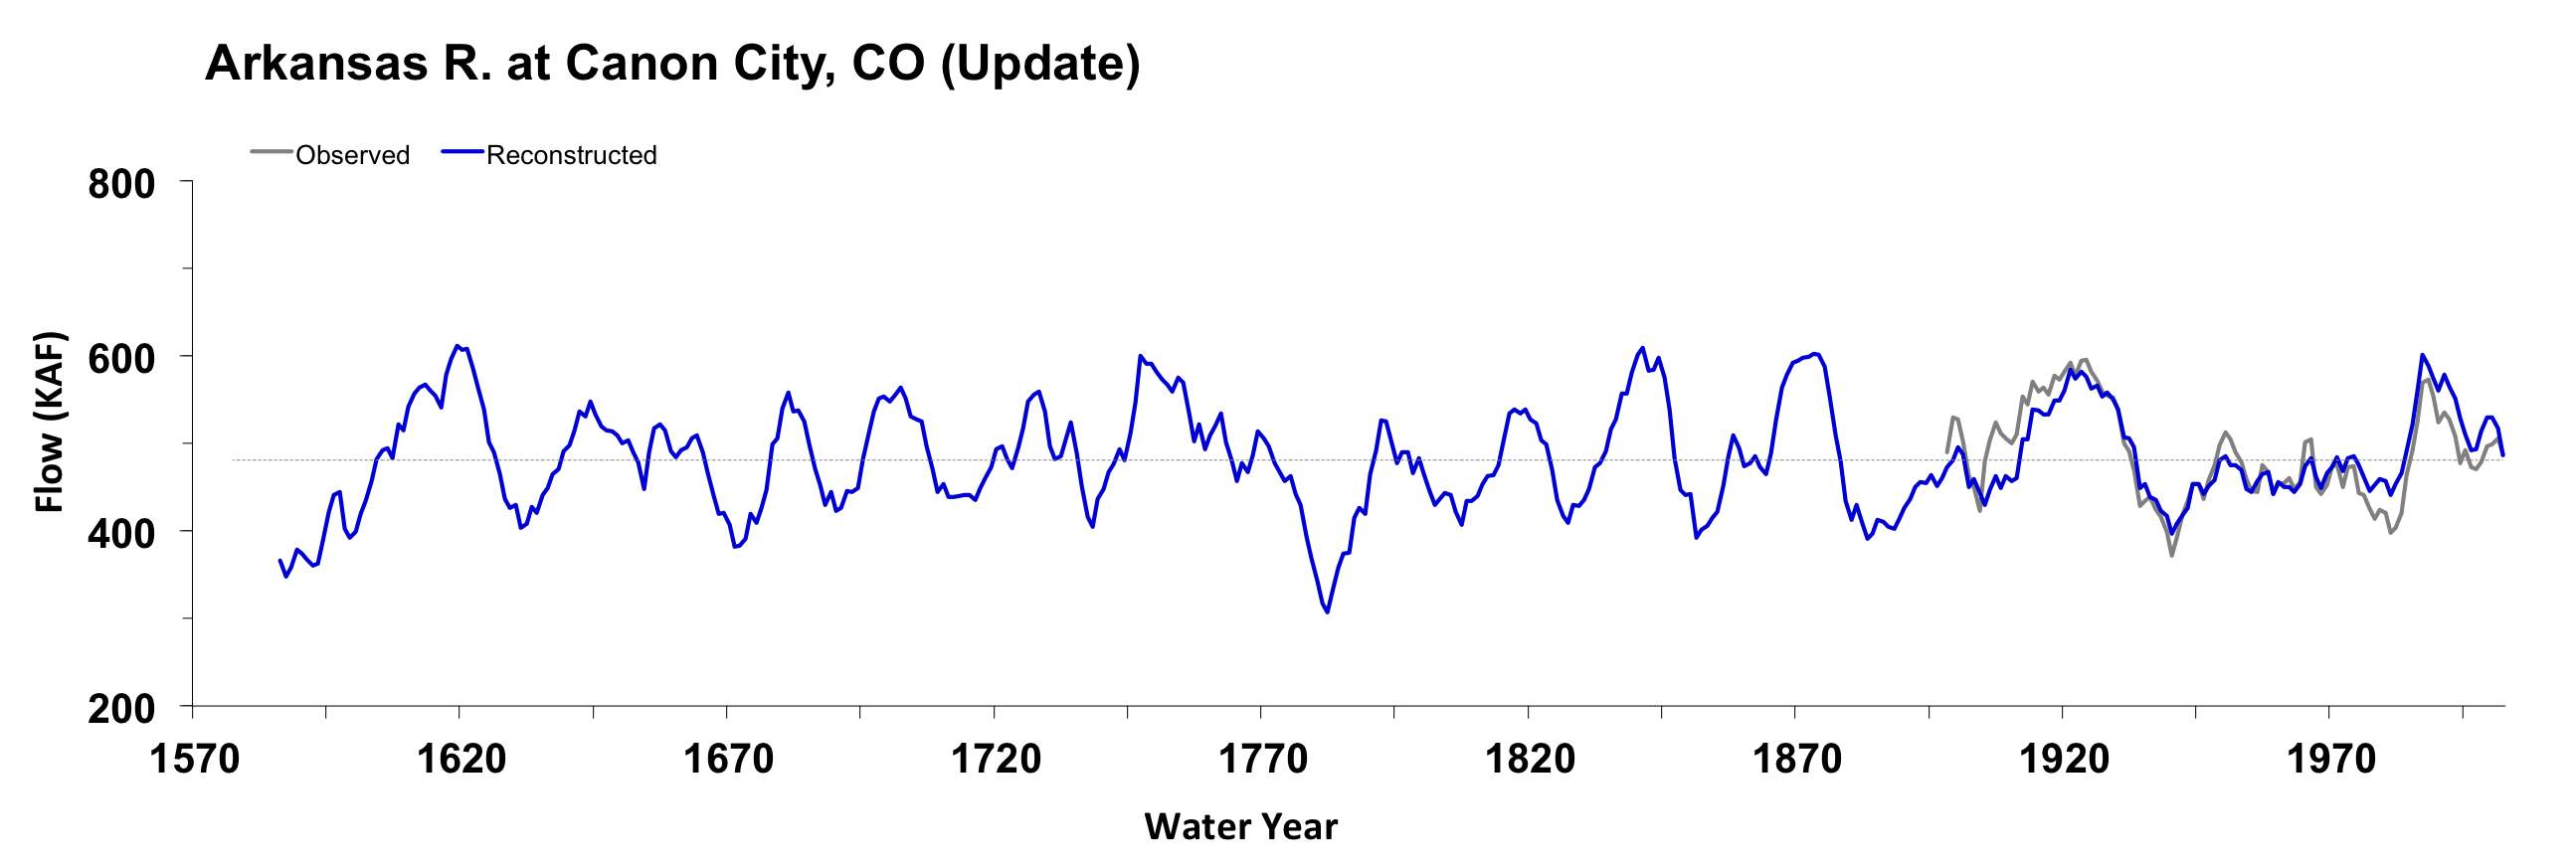
Figure 4. The 10-year running mean (plotted on final year) of reconstructed Arkansas River flow, 1577-2002. Reconstructed values are shown in blue and observed values are shown in gray. The long-term reconstructed mean is shown by the dashed line.

