
Colorado R. at Lees Ferry, AZ (Meko)
In 2006, David Meko (University of Arizona Laboratory of Tree-Ring Research) developed an extended reconstruction of the Colorado River at Lees Ferry, from 762-2005, for the California Department of Water Resources. This reconstruction was made possible by the collection and development of new millennial-length tree-ring chronologies in the Colorado River basin that incorporated extensive remnant (dead) wood. These chronologies were developed by two groups: one led by Meko, and the other by Connie Woodhouse and Jeff Lukas.
This ~1200-year reconstruction for Lees Ferry is very similar--during the 1490-1995 period of overlap--to the ~500-year reconstruction for Lees Ferry developed by Woodhouse, Gray, and Meko, since they share a few predictor chronologies. (A detailed history of reconstructions for the Colorado River basin is provided in Colorado River Streamflow – A Paleo Perspective. Charts which compare the Meko reconstruction with the Woodhouse reconstruction and other Lees Ferry reconstructions can be found on this page.) The outstanding feature of the extended Lees Ferry reconstruction is a sustained dry period in the 1100s, during the Medieval period, thus the paper describing the reconstruction (Meko et al. 2007) focuses on this drought.
References:
Meko, D.M., Woodhouse, C.A., Baisan, C.A., Knight, T., Lukas, J.J., Hughes, M.K., and Salzer, M.W. 2007. Medieval Drought in the Upper Colorado River Basin. Geophysical Research Letters 34, L10705.
Methods
The Meko Lees Ferry reconstruction employed a novel and complex reconstruction method. A complete description of the methodology is provided in Meko et al. (2007), and also in the text data file for the reconstruction archived at the NOAA's World Data Center for Paleoclimatology. In brief: 11 residual tree-ring chronologies were re-generated from the original ring-width data to meet uniform standards for minimum series length and other metrics. Then each chronology was separately regressed against observed flow, resulting in 11 single-site reconstructions of flow. Then these reconstructions were grouped by their time-period coverage into four subsets, so that the entire 762-2005 period was optimally covered. Then within each subset, a principal components analysis (PCA) was run on the covariance matrix of the single-site reconstructions, and the leading principal component (modes of variability) was retained and used for the models. These PC1s were then used as predictors in regressions with observed flow, ultimately generating four sub-period reconstructions of flow. The final reconstruction is composed of the flow values from the subset reconstruction that has the lowest root mean square error (RMSE) of the subset reconstructions (1,2,3, or 4) which are available for a given year. Subset reconstruction (1) provides the values for 762-1181 and 2003, (2) provides 1182-1164, (3) provides 1365-2002, and (4) provides 2004-2005.
| Sub-period reconstruction | Explained variance (R2) | Reduction of Error (RE) | Root Mean Square Error (RMSE) |
| 1 (762-1181, 2003) | 0.60 | 0.58 | 2.804 MAF |
| 2 (1182-1364) | 0.74 | 0.73 | 2.256 MAF |
| 3 (1365-2002) | 0.77 | 0.76 | 2.142 MAF |
| 4 (2004-2005) | 0.57 | 0.54 | 2.942 MAF |
Note: Because the final reconstruction over the calibration period with the observed record (1906-2004) is derived from three different models, the R2 shown in the scatterplot (Figure 1) is not identical to the R2 figures given in the table above. Also, the R2 figures in the table above are adjusted for the number of predictors in each model.
(For explanations of these statistics, see this document (PDF), and also the Reconstruction Case Study page.)
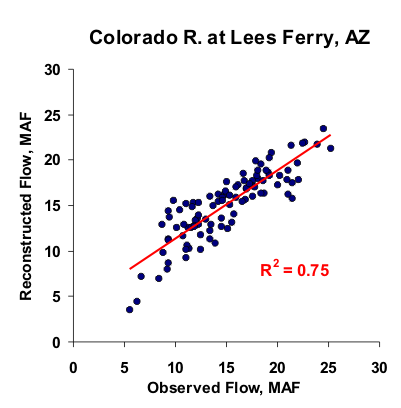
Figure 1. Scatter plot of observed and reconstructed Colorado River annual flow, 1906-2004.
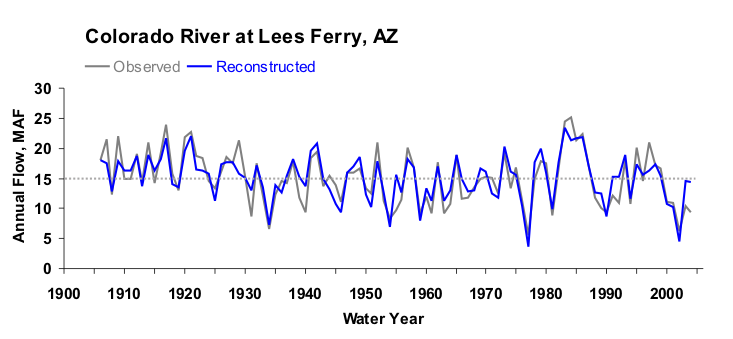
Figure 2. Observed (black) and reconstructed (blue) annual Colorado River annual flow, 1906-2004. The observed mean is illustrated by the dashed line.
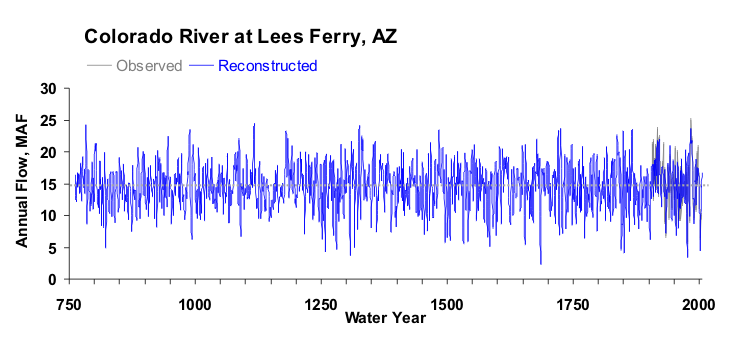
Figure 3. Reconstructed annual flow for the Colorado River flow (762-2005) is shown in blue. Observed flow is shown in gray and the long-term reconstructed mean is shown by the dashed line.
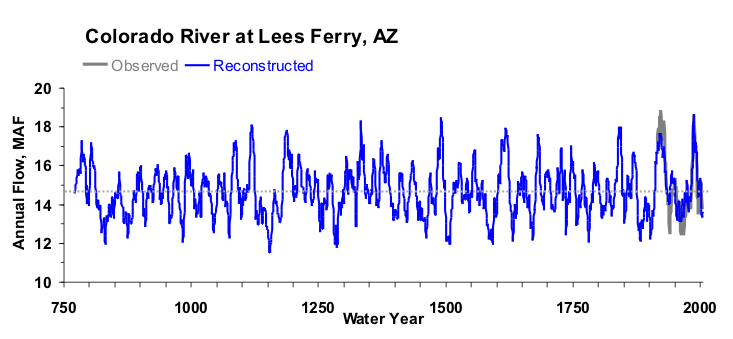
Figure 4. The 10-year running mean (plotted on final year) of reconstructed Colorado River flow, 762-2005. Reconstructed values are shown in blue and observed values are shown in gray. The long-term reconstructed mean is shown by the dashed line.

