
Colorado River near Kremmling, CO
The Colorado River near Kremmling gage represents the overall condition of Denver Water's water supply on the western slope of Colorado. The reconstruction for this gage was developed by Connie Woodhouse and Jeff Lukas in 2005, and then was used in modeling by Denver Water engineers as described on the TreeFlow Applications Page.
Methods
A forward stepwise regression procedure was used to calibrate the observed flow record with a pool of potential predictors consisting of ~30 tree-ring chronologies from Colorado. The residual chronologies, with the low-order autocorrelation removed, were used. Six predictor chronologies were selected by the stepwise procedure for the reconstruction model for the Colorado River near Kremmling. Validation statistics were computed using a leave-one-out (cross-validation) approach.
Predictor Chronologies: Dillon (CO), Gould Reservoir (CO), Pump House (CO), Montrose (CO), Cochetopa Dome (CO), Princeton Douglas-fir (CO)
| Statistic | Calibration | Validation |
| Explained variance (R2) | 0.70 | |
| Reduction of Error (RE) | 0.64 | |
| Standard Error of the Estimate | 172,200 AF | |
| Root Mean Square Error (RMSE) | 172,200 AF |
(For explanations of these statistics, see this document (PDF), and also the Reconstruction Case Study page.)
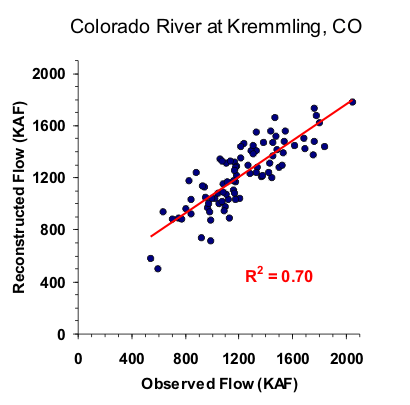
Figure 1. Scatter plot of observed and reconstructed Colorado River annual flow, 1916-2002.
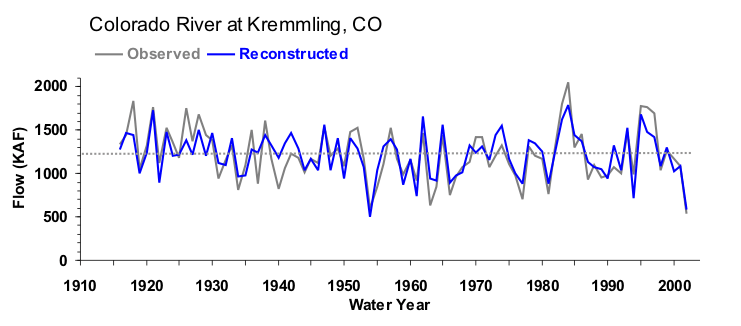
Figure 2. Observed (black) and reconstructed (blue) annual Colorado River annual flow, 1916-2002. The observed mean is illustrated by the dashed line.
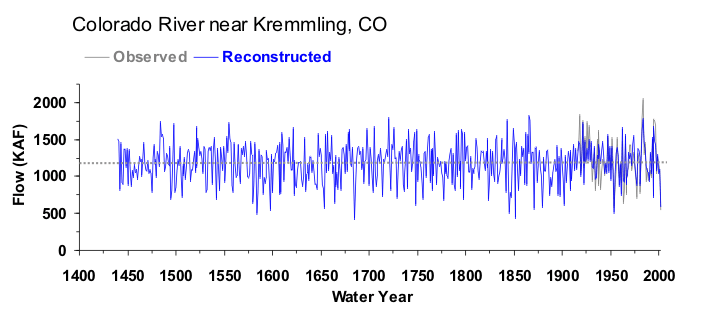
Figure 3. Reconstructed annual flow for the Colorado River (1440-2002) is shown in blue. Observed flow is shown in gray and the long-term reconstructed mean is shown by the dashed line.
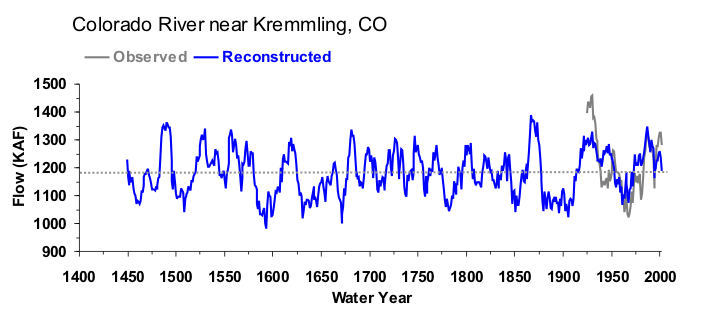
Figure 4. The 10-year running mean (plotted on final year) of reconstructed Colorado River flow, 1440-2002. Reconstructed values are shown in blue and observed values are shown in gray. The long-term reconstructed mean is shown by the dashed line.

