
Rio Grande at Otowi Bridge, NM (NRCS Flows)
In November 2007, Connie Woodhouse, Jeff Lukas, and several colleagues held a workshop in Albuquerque, NM as the first stage of a NOAA-funded project to expand and improve the usability of tree-ring reconstructions for drought planning and water management in the Rio Grande basin. Based on feedback from workshop participants, including staff from the New Mexico Interstate Stream Commission, Woodhouse, Lukas, and David Meko generated two reconstructions for the Rio Grande at Otowi gage. One is calibrated on gaged flows with adjustment by the Natural Resources Conservation Service (NRCS) for the San Juan/Chama diversion and evaporation and storage effects of two reservoirs, and the other is calibrated primarily on the sum of 10 headwaters and tributary gages largely unimpacted by diversions and depletions (see this presentation for details). These two reconstructions, along with one for the Canadian River in the Arkansas River basin, were presented at a follow-up workshop in Albuquerque in May 2008.
Methods
Because the relationship between the observed flow record and the tree-ring chronologies used in the single predictor tended to be non-linear, the observed records was transformed into log 10 units prior to calibration. Linear regression was then used to calibrate the log-transformed observed flow record with a single predictor, which was the simple average of 17 tree-ring chronologies from Colorado, northern New Mexico, and southeast Utah that spanned the period 1450-2002. The residual chronologies, with the low-order autocorrelation removed, were used. Validation statistics were computed using a leave-one-out (cross-validation) approach. After calibration and validation, the reconstructed flows were back-transformed from log units to the original units (acre-feet).
Predictor: Mean of these 17 chronologies: Mesa Alta - pine (NM), Fenton Lake (NM), Beef Basin (UT), Navajo Canyon (CO), Lands End (CO), Wild Rose (CO), Princeton Douglas-fir (CO), McPhee-Dolores (CO), Sargents (CO), Unaweep (CO), Pump House (CO), Cathedral Creek (CO), Gould Reservoir (CO), Trail Gulch (CO), Montrose (CO), Slickrock (CO), Chokecherry Canyon (CO)
Note: the calibration and validation statistics below were computed during the model development and reflect the relationship between the log-transformed observed flow record and the tree-ring predictor. The scatterplot below in Figure 1 shows the relationship between the back-transformed observed flows and the reconstructed flows, which have a lower R2. Also, the Standard Error of the Estimate and Root Mean Square Error reported below are in log units, and the RMSE can't be used to compute confidence intervals.
| Statistic | Calibration | Validation |
| Explained variance (R2) | 0.74 | |
| Reduction of Error (RE) | 0.72 | |
| Standard Error of the Estimate | 0.1157 | |
| Root Mean Square Error (RMSE) | 0.1163 |
(For explanations of these statistics, see this document (PDF), and also the Reconstruction Case Study page.)
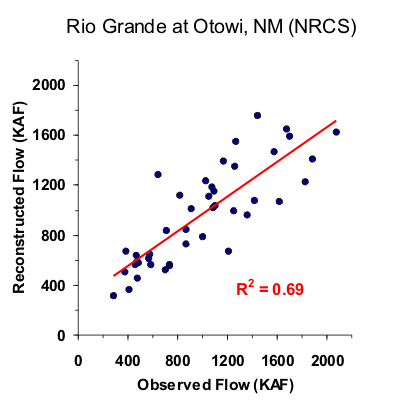
Figure 1. Scatter plot of observed and reconstructed Rio Grande annual flow, 1958-2000.
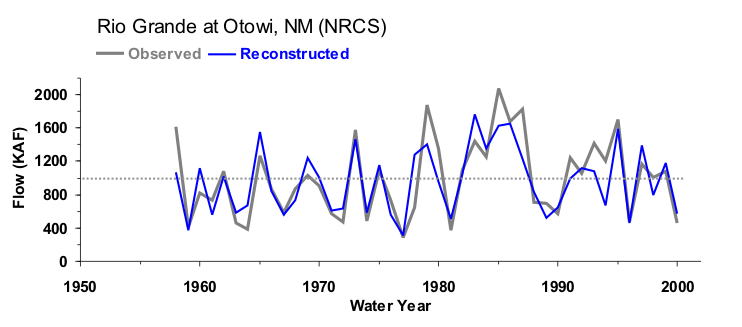
Figure 2. Observed (black) and reconstructed (blue) Rio Grande annual flow, 1958-2000. The observed mean is illustrated by the dashed line.
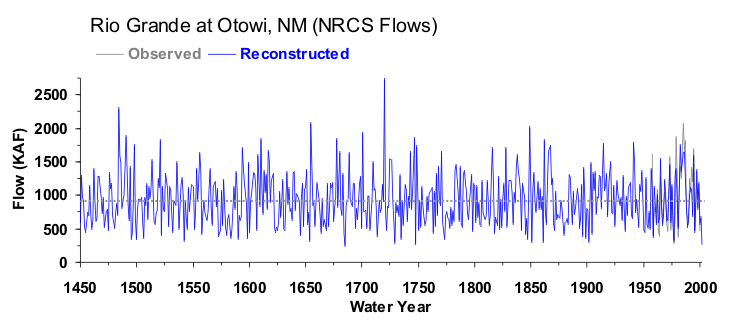
Figure 3. Reconstructed annual flow for the Rio Grande (1450-2002) is shown in blue. Observed flow is shown in gray and the long-term reconstructed mean is shown by the dashed line.
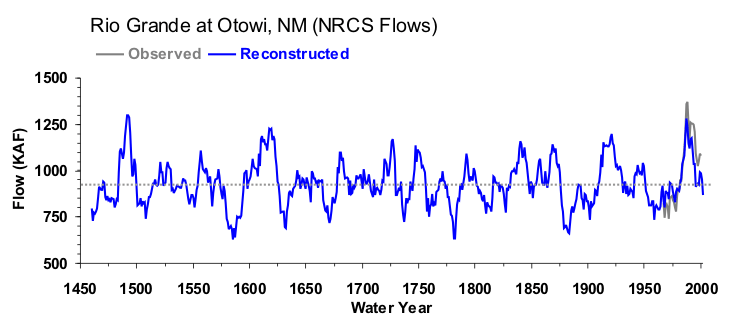
Figure 4. The 10-year running mean (plotted on final year) of reconstructed Rio Grande flow, 1450-2002. Reconstructed values are shown in blue and observed values are shown in gray. The long-term reconstructed mean is shown by the dashed line.

