
Rio Grande at Owoti, New Mexico (update)
This reconstruction is an update of the original reconstruction of the Rio Grande at Otowi Bridge, New Mexico. This update was undertaken at the request of the New Mexico Interstate Steam Commission (ISC) to update the existing tree-ring based annual streamflow reconstruction for the Rio Grande at Otowi Bridge gage to 2012.
The original Rio Grande flow at Otowi reconstruction was developed in 2008 by David Meko, Connie Woodhouse and Jeff Lukas. The reconstruction was based on estimated natural flows for the Otowi gage (Otowi Index Supply, OIS) obtained from Kevin Flannigan of the ISC for the period from 1940 to 2000. In this record, adjustments were made to the gaged flows to account for the San Juan-Chama project diversion (transmountain diversions to the Rio Grande basin) and evaporation and storage effects of reservoirs on the Rio Chama, major tributary to the Rio Grande above the Otowi gage. In this updated version, the ISC provided computed OIS for the Otowi gage, updated to 2012.
Methods
Six chronologies from Colorado were updated to 2013 for this study, and one additional chronology, from New Mexico was obtained from Chris Guiterman (graduate student at the UA Laboratory of Tree-Ring Research) that extended to 2010. The six updated residual chronologies and the six plus the Mesa Alta residual chronology were averaged to create two different predictors for potential reconstruction models. The 6-chronology average extended to 2012, while the 7-chronology average ended in 2011. Because the relationship between the chronology average and the flow record showed evidence of a non-linear relationship, the flow record was transformed with a log 10 transformation. Two simple linear regression models were fit, with the each of the chronology averages as the predictor and the transformed flow series as the predictand, using all common years (1940-2011 or 1940-2012) for the model calibration. The 7-chronology model was used for the final updated reconstruction, but since it ended in 2011, the value for the 6-chronology reconstruction was used for 2012 flow estimate. The final reconstruction extends 1450-2012. Validation of the model was based on a leave-one-out cross validation strategy.
Predictors: Wild Rose (WIL), Unaweep (UNA), Gould Reservoir (GOU), Slick Rock (SLK), and Almont Triangle (ATR) were from west of the Continental Divide; Chokecherry Canyon (CCC) and Mesa Alta (MEA) were from the Rio Grande basin.
| Statistic | Calibration | Validation |
| Explained variance (R2) | 0.74 | |
| Reduction of Error (RE) | 0.73 | |
| Standard Error of the Estimate | 0.1194 | |
| Root Mean Square Error (RMSE) | 0.1205 |
*Statistics were computed on the log-transformed observed flow record and the tree-ring predictor. The standard error of the estimate and root mean squared error (RMSE) are in log units.
(For explanations of these statistics, see this document (PDF), and also the Reconstruction Case Study page.)

Figure 1. Scatter plot of observed and reconstructed Rio Grande annual flow, 1940-2012.
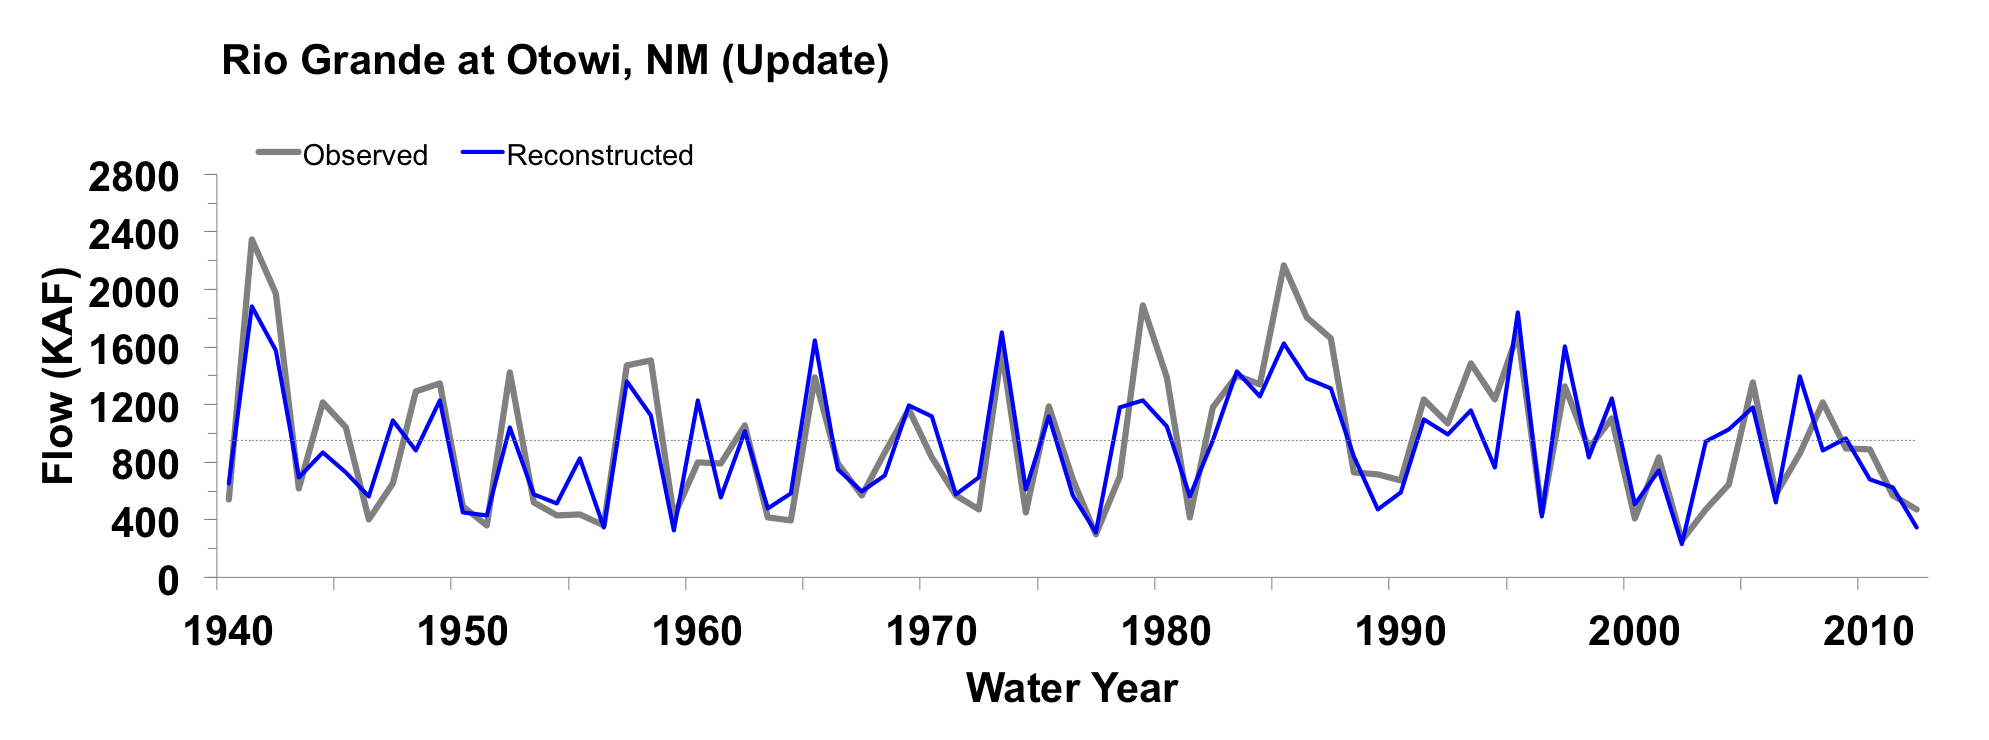
Figure 2. Observed (black) and reconstructed (blue) Rio Grande annual flow, 1940-2012. The observed mean is illustrated by the dashed line.
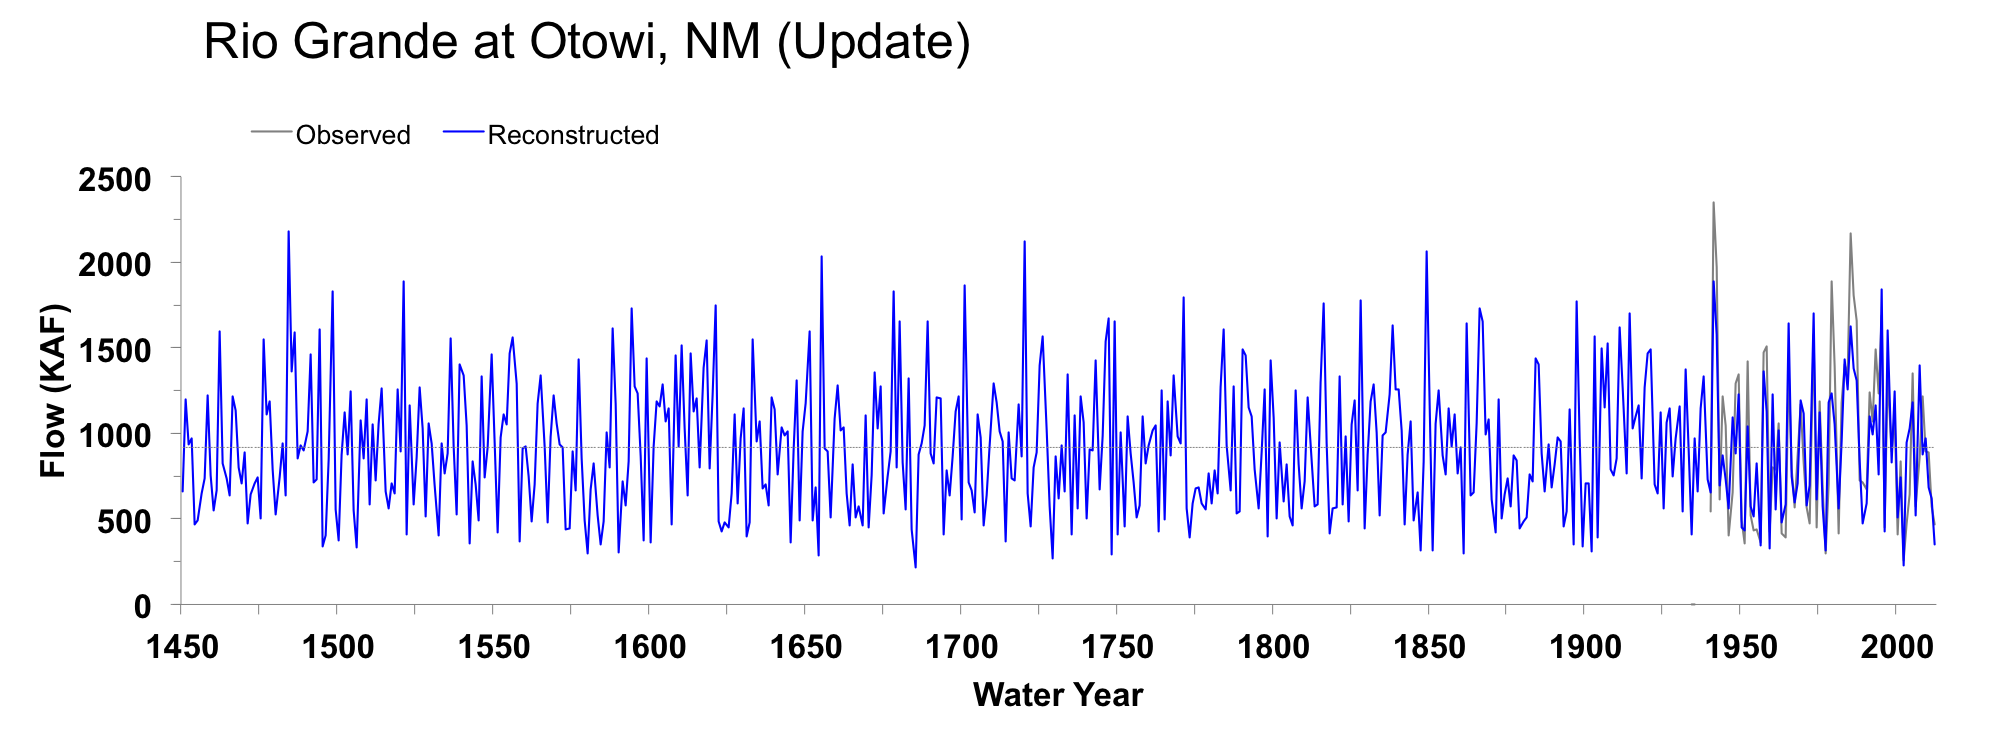
Figure 3. Reconstructed annual flow for the Rio Grande (1450-2012) is shown in blue. Observed flow is shown in gray and the long-term reconstructed mean is shown by the dashed line.
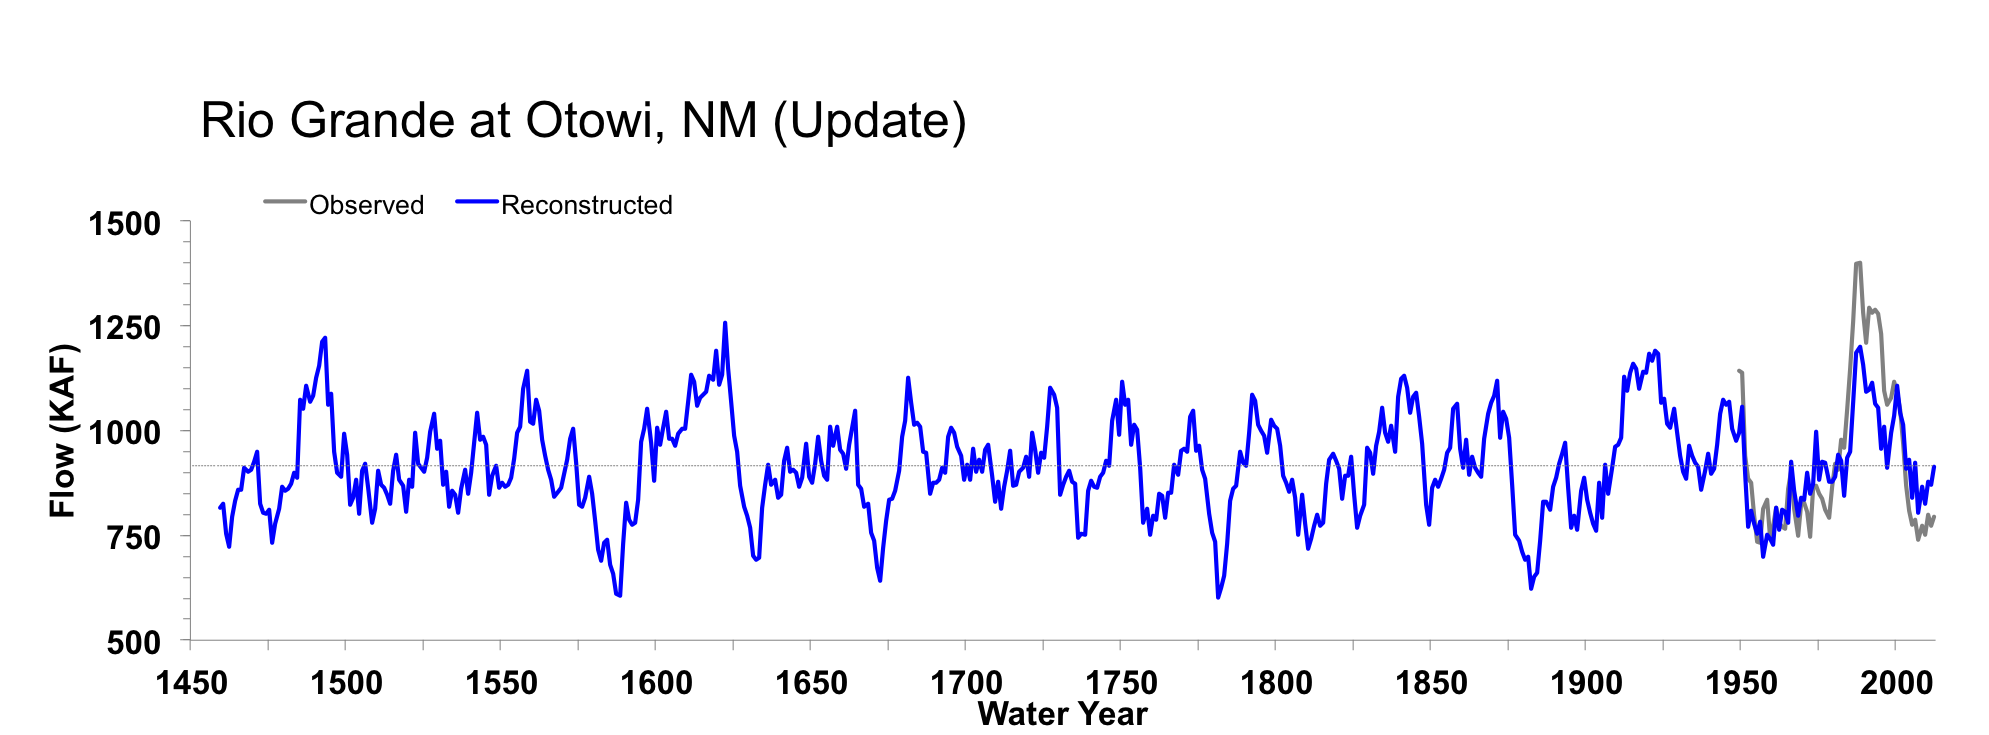
Figure 4. The 10-year running mean (plotted on final year) of reconstructed Rio Grande flow, 1450-2012. Reconstructed values are shown in blue and observed values are shown in gray. The long-term reconstructed mean is shown by the dashed line.

