
Sacramento River - Four Rivers Index, CA Update
The Sacramento River and its tributaries (the Feather, Yuba, and American Rivers), together comprising the "Sacramento Four Rivers Index", represent the primary input into the California State Water Project, operated by the California Department of Water Resources (CADWR). In 2013-2014, David Meko and Ramzi Touchan (University of Arizona Laboratory of Tree-Ring Research) updated the original reconstruction of the Sacramento River, Four Rivers Index (900-2012), for the CADWR. New collections expanded the tree-ring network and allowed an extension to 2012. Meko and Touchan also developed reconstructions for the Sacramento River at Bend Bridge, Feather River inflow to Lake Oroville, Yuba River at Smartville, and American River inflow to Folsom Lake as part of this project.
References:
Klamath/San Joaquin/Sacramento Hydroclimatic Reconstructions, Final Report to CADWR from Tree Rings
Methods
Water-year-total flows for the Sacramento Four Rivers were reconstructed by locally weighted regression, or Loess from subsets of 61 chronologies screened for Sacramento/San Joaquin basin reconstructions. A Loess reconstruction was defined as an interpolation of estimated flow from a smoothed scatterplot of observed flow on a single summary tree-ring variable. The tree-ring predictor was an average of standard chronologies that were filtered and scaled to accentuate their statistical signal for the target flow gage. A time-nested-modeling approach was used for reconstructions, using progressively longer but smaller subsets of chronologies going back in time to calibrate subsets of reconstrutions. The percentage of flow variance accounted for by the “median-accuracy” model ranges from 68% for the Sacramento River (Sacramento River above Bend Bridge) to 78% for the San Joaquin River. Because these reconstructions are done with time-nested models, accuracy varies over time depending on the quality of the available tree-ring chronologies.
| Statistic | Calibration | Validation |
| Explained variance (R2) | 0.73 | |
| Reduction of Error (RE) | 0.73 | |
| Standard Error of the Estimate | 3937 KAF | |
| Root Mean Square Error (RMSE) | 4238 KAF |
Note: the calibration and validation statistics above were computed during the model development and reflect the relationship between the log-transformed observed flows and the tree-ring predictors. The scatterplot below in Figure 1 shows the relationship between the back-transformed observed flows and the reconstructed flows.
(For explanations of these statistics, see this document (PDF), and also the Reconstruction Case Study page.)
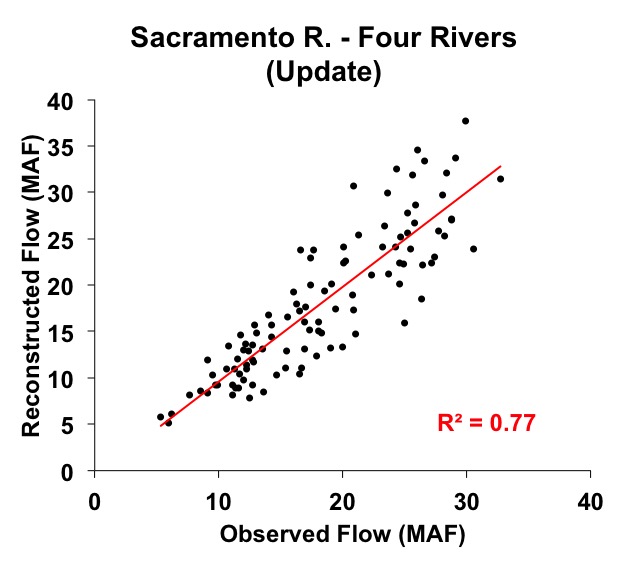
Figure 1. Scatter plot of observed and reconstructed Sacramento River annual flow, 1906-2011.
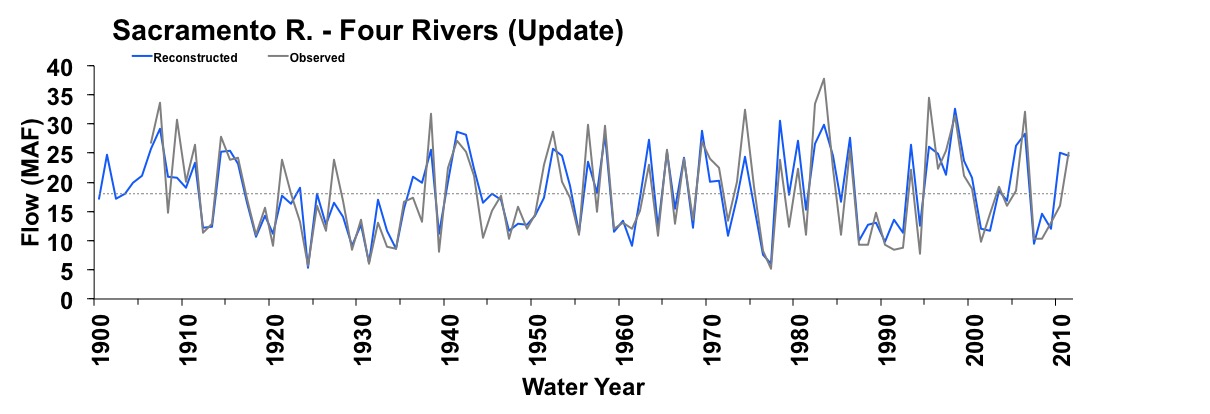
Figure 2. Observed (black) and reconstructed (blue) annual Sacramento River annual flow, 1906-2011. The observed mean is illustrated by the dashed line.
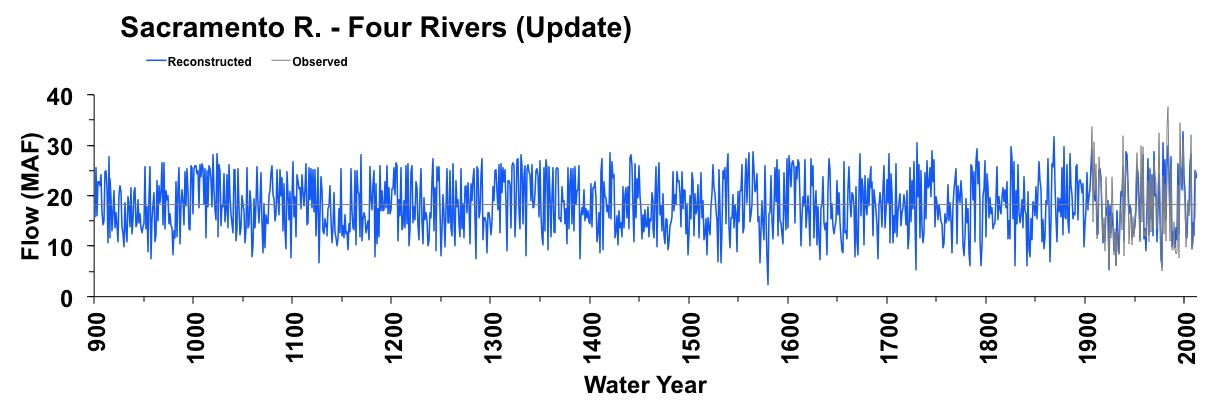
Figure 3. Reconstructed annual flow for the Sacramento River flow (900-2012) is shown in blue. Observed flow is shown in gray and the long-term reconstructed mean is shown by the dashed line.
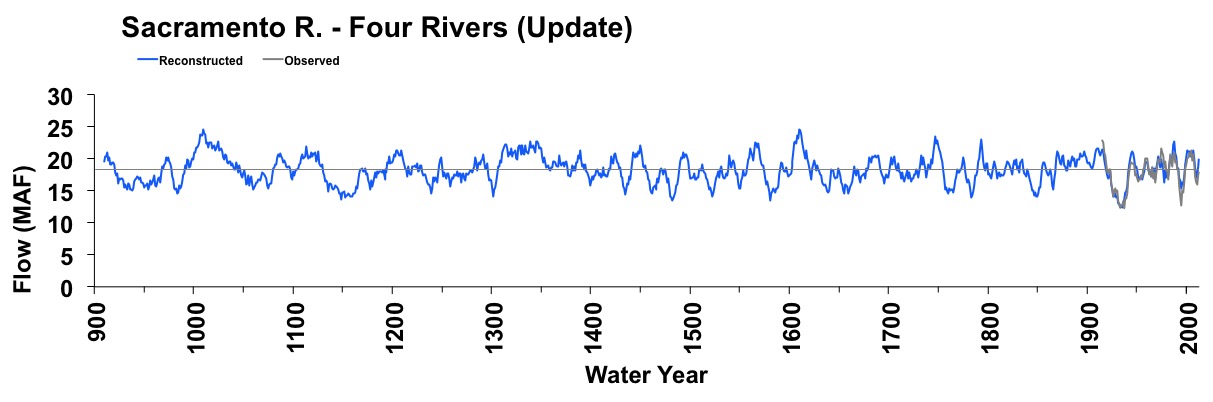
Figure 4. The 10-year running mean (plotted on final year) of reconstructed Sacramento River flow, 900-2012. Reconstructed values are shown in blue and observed values are shown in gray. The long-term reconstructed mean is shown by the dashed line.

