
Salinas River at Paso Robles, CA
The Salinas River Valley is the largest basin in the central coast region of California. Known as "America's Salad Bowl," the Salinas Valley is home to one of the most productive agricultural economies in the world. This dynamic industry is heavily dependent on groundwater irrigation from aquifers that are principally recharged by streamflow that originates as precipitation within the basin. Most of the flow of the Salinas at Paso Robles is subsurface, and the observed record typically shows zero flow during summer months. In severe droughts, there is no recorded flow throughout the water year. In 2005, Dan Griffin (then at University of Arkansas Tree-Ring Laboratory, now at the University of Arizona Laboratory of Tree-Ring Research) developed a 600-year reconstruction of the Salinas River using remarkably drought-sensitive blue oak chronologies from the central coast region. These chronologies are highly correlated with all of the precipitation and streamflow records within the basin, and the reconstruction is generally representative of the central coast region's hydroclimatic history.
References:
Griffin, R.D. 2007. A 600-Year Streamflow History in the Salinas Valley Reconstructed from Blue Oak Tree Rings. M.A. Thesis. University of Arkansas, Fayetteville. 67 pages.
Griffin, R.D. 2005. Paleohydrology of the Salinas River, California, reconstructed from blue oak tree rings. Geological Society of America Annual Meeting, Denver, CO, October 16, 2005.
Methods
The simple mean of 4 blue oak tree-ring chronologies from central California was used as a single predictor in a linear regression against the observed flow. The residual chronologies, with low-order persistence removed, were used. Validation statistics were computed using a leave-one-out (cross-validation or PRESS) approach.
Predictor: Mean of these chronologies: Rock Springs Mountain (CA), Wright Mountain (CA), Figueroa Mountain (CA), Los Lobos Creek (CA)
| Statistic | Calibration | Validation |
| Explained variance (R2) | 0.73 | |
| Reduction of Error (RE) | 0.68 | |
| Standard Error of the Estimate | 70.35 | |
| Root Mean Square Error (RMSE) | 72.04 |
(For explanations of these statistics, see this document (PDF), and also the Reconstruction Case Study page.)
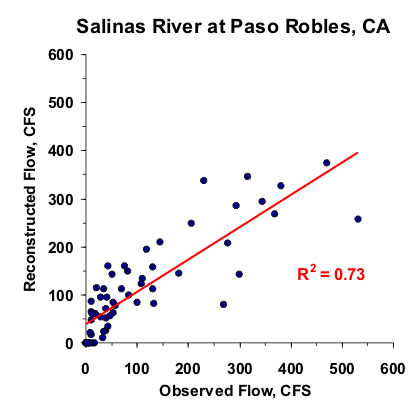
Figure 1. Scatterplot of observed and reconstructed Salinas River annual flow, 1940-2003.
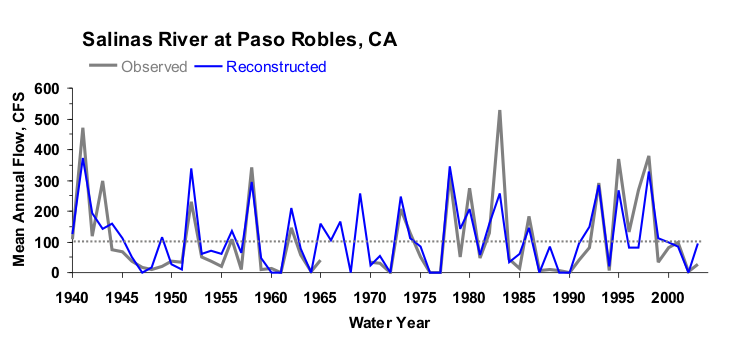
Figure 2. Observed (black) and reconstructed (blue) annual Salinas River annual flow, 1940-2003. The observed mean is illustrated by the dashed line.
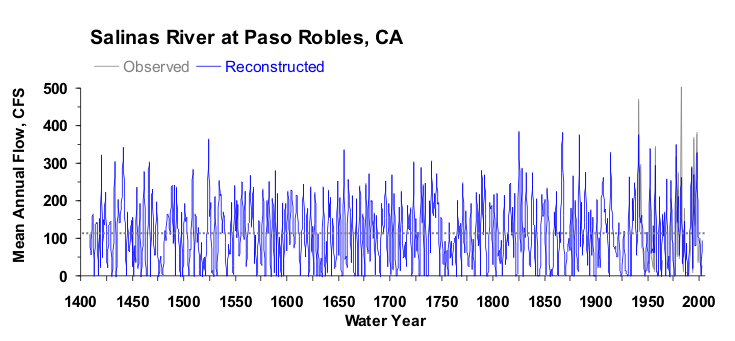
Figure 3. Reconstructed annual flow for the Salinas River flow (1409-2003) is shown in blue. Observed flow is shown in gray and the long-term reconstructed mean is shown by the dashed line.
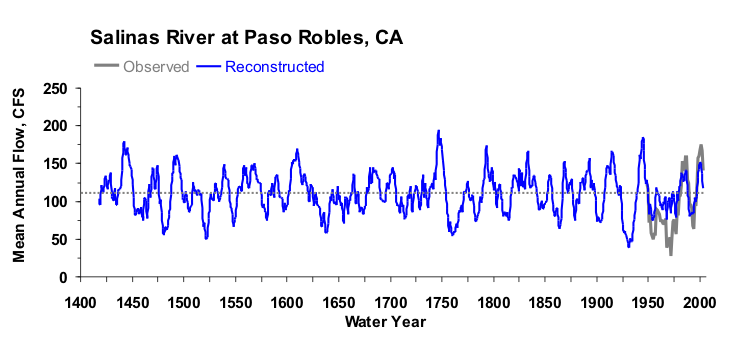
Figure 4. The 10-year running mean (plotted on final year) of reconstructed Salinas River flow, 1409-2003. Reconstructed values are shown in blue and observed values are shown in gray. The long-term reconstructed mean is shown by the dashed line.

