
Santa Fe River near Santa Fe, NM (Long)
The Santa Fe River is a minor tributary of the Rio Grande with a major role supplying water for the city of Santa Fe—about half of the city's use in recent years. In the mid-2000s, Ellis Margolis of the University of Arizona's Laboratory of Tree-Ring Research (LTRR) began working with the city of Santa Fe to investigate the long-term environmental history of the watershed. Given the concerns about recent large, high-severity fires in the region, the first stage of the work was to reconstruct fire history and forest age structure of the upper Santa Fe River (Margolis and Balmat 2009).
The second stage was to reconstruct the long-term hydrology of the river. New and updated chronologies from the Santa Fe watershed and surrounding area were collected in 2007, and combined with new chronologies from the Jemez Mountains northwest of Santa Fe to generate two reconstructions of the Santa Fe River: a "short" reconstruction (1592-2007) shown on this page, and a "long" reconstruction (1305-2007) shown here. Both reconstructions were published in Margolis et al. (2011). The short reconstruction is more robust, while the long reconstruction provides a longer window onto the past variability of the Santa Fe River.
References:
Margolis, E.Q., Balmat, J., 2009. Fire history and fire-climate relationships along a fire regime gradient in the Santa Fe Municipal Watershed, NM, USA. Forest Ecology and Management 258, 2416–2430.
Margolis, E. Q., Meko, D. M., and R. Touchan. 2011. A tree-ring reconstruction of streamflow in the Santa Fe River, New Mexico. Journal of Hydrology, 397(1-2): 118-127.
Methods
First, a log10 transform was performed on the observed flow record to reduce the strong positive skew of the flow record and make the skew characteristic close to that of the predictor chronologies. Then forward stepwise multiple linear regression was used to regress the log10 of calendar year streamflow on five tree-ring chronologies from north-central New Mexico. Four different models were tested: using residual or standard chronologies, and using the chronologies themselves or principal components (PCs) derived from them. The model which performed the best was based on the PCs (PC1 and PC2) from the residual chronologies, with the low-order autocorrelation removed. Validation statistics were computed using both a leave-one-out (cross-validation) approach, and a split-sample approach.
Predictors: Principal components #1 and #2 derived from 5 chronologies: Sante Fe Watershed PIST (NM), Bear Canyon West (NM), Echo Amphitheater (NM), Fenton Lake (NM), Mesa Alta (NM)
| Statistic | Calibration | Validation |
| Explained variance (R2) (Cross-validation/Split-sample1/Split-sample2) |
0.50/0.54/0.50 | |
| Reduction of Error (RE) (Split-sample1/Split-sample2) |
0.28/0.48 | |
| Standard Error of the Estimate (Cross-validation) |
0.2023* | |
| Root Mean Square Error (RMSE) (Cross-validation) |
0.2060* |
(For explanations of these statistics, see this document (PDF), and also the Reconstruction Case Study page.)
*These statistics were calculated on the transformed flow values, and are unitless.
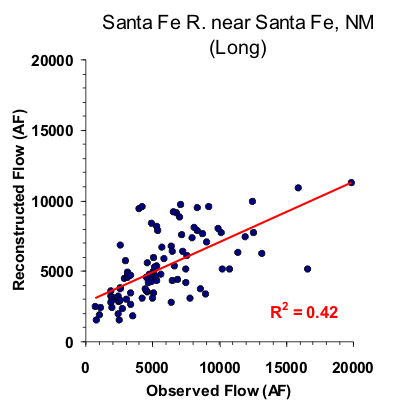
Figure 1. Scatter plot of observed and reconstructed Santa Fe River annual flow, 1914-2007. (Note that the R2 value in the figure differs from the calibration R2 provided in the table above, because the former is based on the back-transformed flow values.)
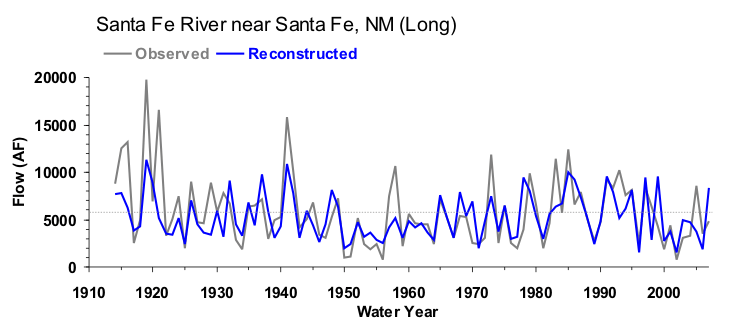
Figure 2. Observed (black) and reconstructed (blue) Santa Fe River annual flow, 1914-2007. The observed mean is illustrated by the dashed line.
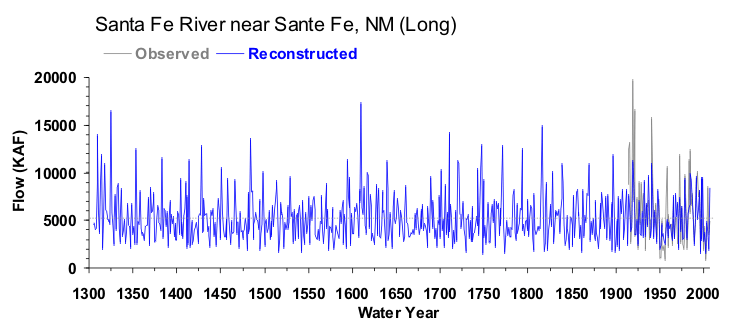
Figure 3. Reconstructed annual flow for the Santa Fe River (1305-2007) is shown in blue. Observed flow is shown in gray and the long-term reconstructed mean is shown by the dashed line.
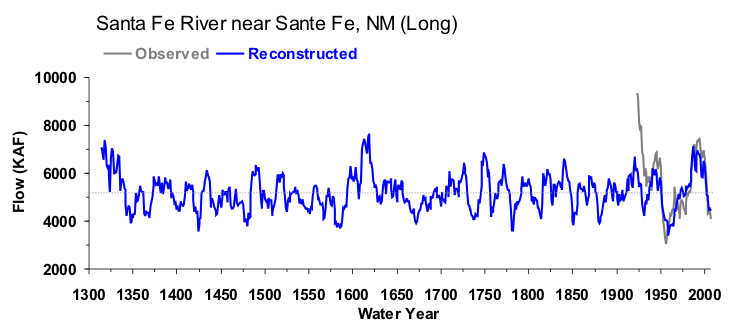
Figure 4. The 10-year running mean (plotted on final year) of reconstructed Santa Fe River flow, 1305-2007. Reconstructed values are shown in blue and observed values are shown in gray. The long-term reconstructed mean is shown by the dashed line.

