
South Boulder Creek near Eldorado Springs, CO
The City of Boulder obtains about 80% of its water supply from the Boulder Creek watershed, and return flows from the city are extensively used for agriculture downstream. While the city does not draw water directly from it, South Boulder Creek meets Boulder Creek above the city wastewater treatment plant and thus it is monitored by the city.
The first reconstruction for the South Boulder Creek near Eldorado Springs gage was developed by Connie Woodhouse in 2001. An updated reconstruction was developed in 2005, by Jeff Lukas and Connie Woodhouse, for AMEC Earth & Environmental (formerly Hydrosphere), consultants for the City of Boulder. The calibration period includes the extreme drought year of 2002.
References:
Woodhouse, C., and J. Lukas. Streamflow Reconstructions for Boulder Creek, South Boulder Creek, and the Colorado River. Report to City of Boulder and Hydrosphere Resource Consultants, January 2006.
Methods
A forward stepwise regression procedure was used to calibrate the observed flows with a pool of potential predictors consisting of ~25 tree-ring chronologies from Colorado (both east-slope and west-slope). The residual chronologies, with the low-order autocorrelation removed, were used. Five predictor chronologies were selected by the stepwise procedure for the reconstruction model. Validation statistics were computed using a leave-one-out (cross-validation) approach.
Predictors: Van Bibber Update (CO), Pump House (CO), Big Thompson Update (CO), Dillon (CO), Chokecherry Canyon (CO)
| Statistic | Calibration | Validation |
| Explained variance (R2) | 0.69 | |
| Reduction of Error (RE) | 0.65 | |
| Standard Error of the Estimate | 11,100 AF | |
| Root Mean Square Error (RMSE) | 11,361 AF |
(For explanations of these statistics, see this document (PDF), and also the Reconstruction Case Study page.)

Figure 1. Scatterplot of observed and reconstructed South Boulder Creek annual flow, 1907-2002.
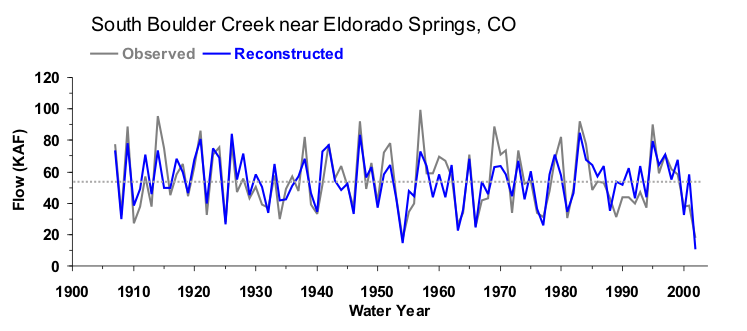
Figure 2. Observed (black) and reconstructed (blue) annual South Boulder Creek annual flow, 1907-2002. The observed mean is illustrated by the dashed line.
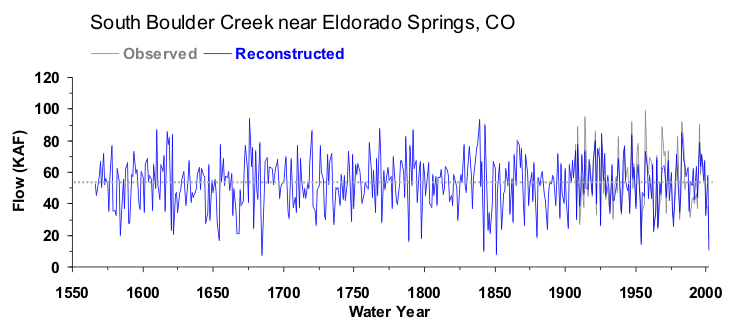
Figure 3. Reconstructed annual flow for South Boulder Creek (1566-2002) is shown in blue. Observed flow is shown in gray and the long-term reconstructed mean is shown by the dashed line.
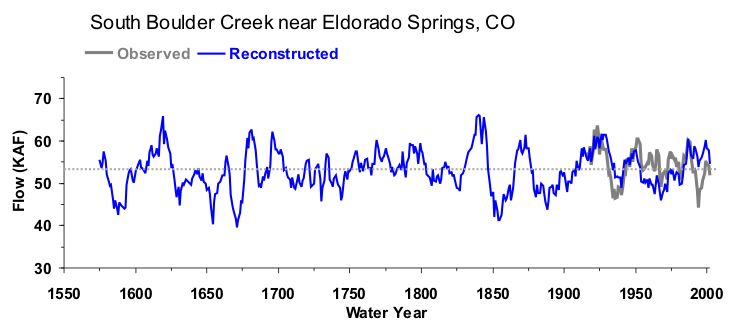
Figure 4. The 10-year running mean (plotted on final year) of reconstructed South Boulder Creek flow, 1566-2002. Reconstructed values are shown in blue and observed values are shown in gray. The long-term reconstructed mean is shown by the dashed line.

