
Animas River at Durango, CO
The Animas River is an important tributary of the San Juan River, and the Durango gage represents much of the total runoff of the Animas River basin. After consultation with participants in a workshop in Durango in 2007, the reconstruction for this gage was developed by Jeff Lukas, and then was presented to Animas stakeholders participating in a follow-up workshop in 2008. A Powerpoint presentation on the reconstruction provides additional details.
Methods
A forward stepwise regression procedure was used to calibrate the observed flow record with a pool of potential predictors consisting of 24 tree-ring chronologies from western Colorado and northwestern New Mexico. The residual chronologies, with the low-order autocorrelation removed, were used. Four predictor chronologies were selected by the stepwise procedure for the reconstruction model for the Animas River at Durango. Validation statistics were computed using a leave-one-out (cross-validation) approach.
Predictor Chronologies: Slickrock (CO), Trail Gulch (CO), Princeton Douglas-fir (CO), Wild Rose (CO)
| Statistic | Calibration | Validation |
| Explained variance (R2) | 0.82 | |
| Reduction of Error (RE) | 0.80 | |
| Standard Error of the Estimate | 83,409 AF | |
| Root Mean Square Error (RMSE) | 86,310 AF |
(For explanations of these statistics, see this document (PDF), and also the Reconstruction Case Study page.)
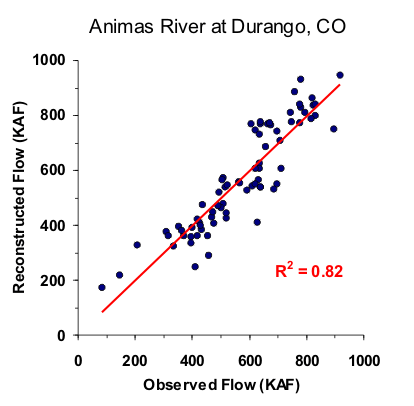
Figure 1. Scatter plot of observed and reconstructed Animas River annual flow, 1928-2002.
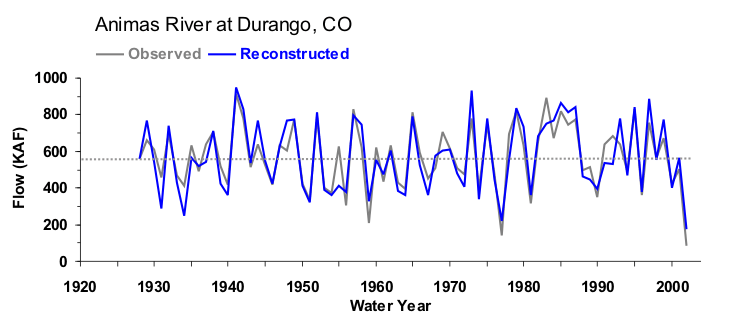
Figure 2. Observed (black) and reconstructed (blue) annual Animas River annual flow, 1928-2002. The observed mean is illustrated by the dashed line.
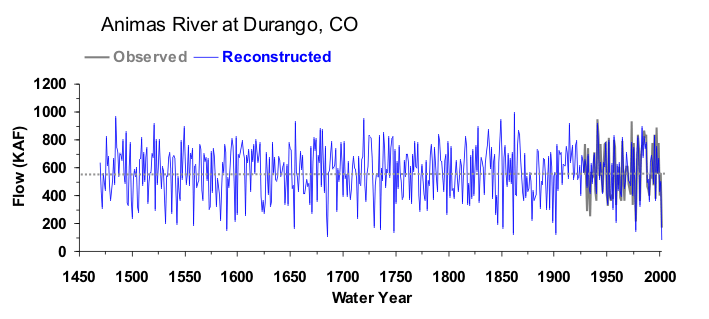
Figure 3. Reconstructed annual flow for the Animas River (1470-2002) is shown in blue. Observed flow is shown in gray and the long-term reconstructed mean is shown by the dashed line.
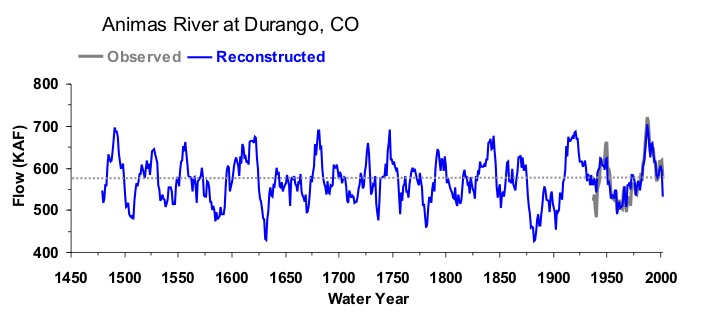
Figure 4. The 10-year running mean (plotted on final year) of reconstructed Animas River flow, 1470-2002. Reconstructed values are shown in blue and observed values are shown in gray. The long-term reconstructed mean is shown by the dashed line.

