
Arkansas River at Salida, Colorado
This reconstruction was developed in collaboration with Colorado Springs Utilities in 2010. An updated reconstruction for the Arkansas River at Cañon City was part of this project. Naturalized streamflow data were obtained from Colorado Springs Utilities for the Arkansas River, for the water years 1910-2003. The raw gage data (before naturalizing) reflect transmountain diversions from the upper Colorado River into the Arkansas River as well as diversions for agriculture. The estimated natural flows were calculated based on the USGS gage data for the Salida gage, subtracting transmountain inputs, adding Otero Pipeline water, and accounting for changes in storage at Turquoise, Twin Lakes, and Clear Creek reservoirs. Estimates were based on what was considered to be the best available data, but in some cases, multiple, conflicting records existed. Thus uncertainties in the estimates exist.
Methods
The set of 22 standard chronologies made up the pool of candidate predictors for the reconstruction model. Standard chronologies were used because the flow series contained low but statistically significant (p < 0.05) first order autocorrelation. A stepwise regression model was calibrated on the full gage record, resulted in a model with four predictors. Validation of the model was based on a leave-one-out cross validation strategy. The full reconstruction extended 1440-2002.
Predictor Chronologies: Trail Gulch (TRG), Pumphouse (PUM), and Montrose (MTR), all Pinus edulis sites on the west slope of the Continental Divide, and Princeton Douglas-fir (PRD) in the Arkansas River drainage
| Statistic | Calibration | Validation |
| Explained variance (R2) | 0.62 | |
| Reduction of Error (RE) | 0.58 | |
| Standard Error of the Estimate | 69,351 AF | |
| Root Mean Square Error (RMSE) | 71,072 AF |
Methods
(For explanations of these statistics, see this document (PDF), and also the Reconstruction Case Study page.)
*These statistics were calculated on the transformed flow values, and are unitless.
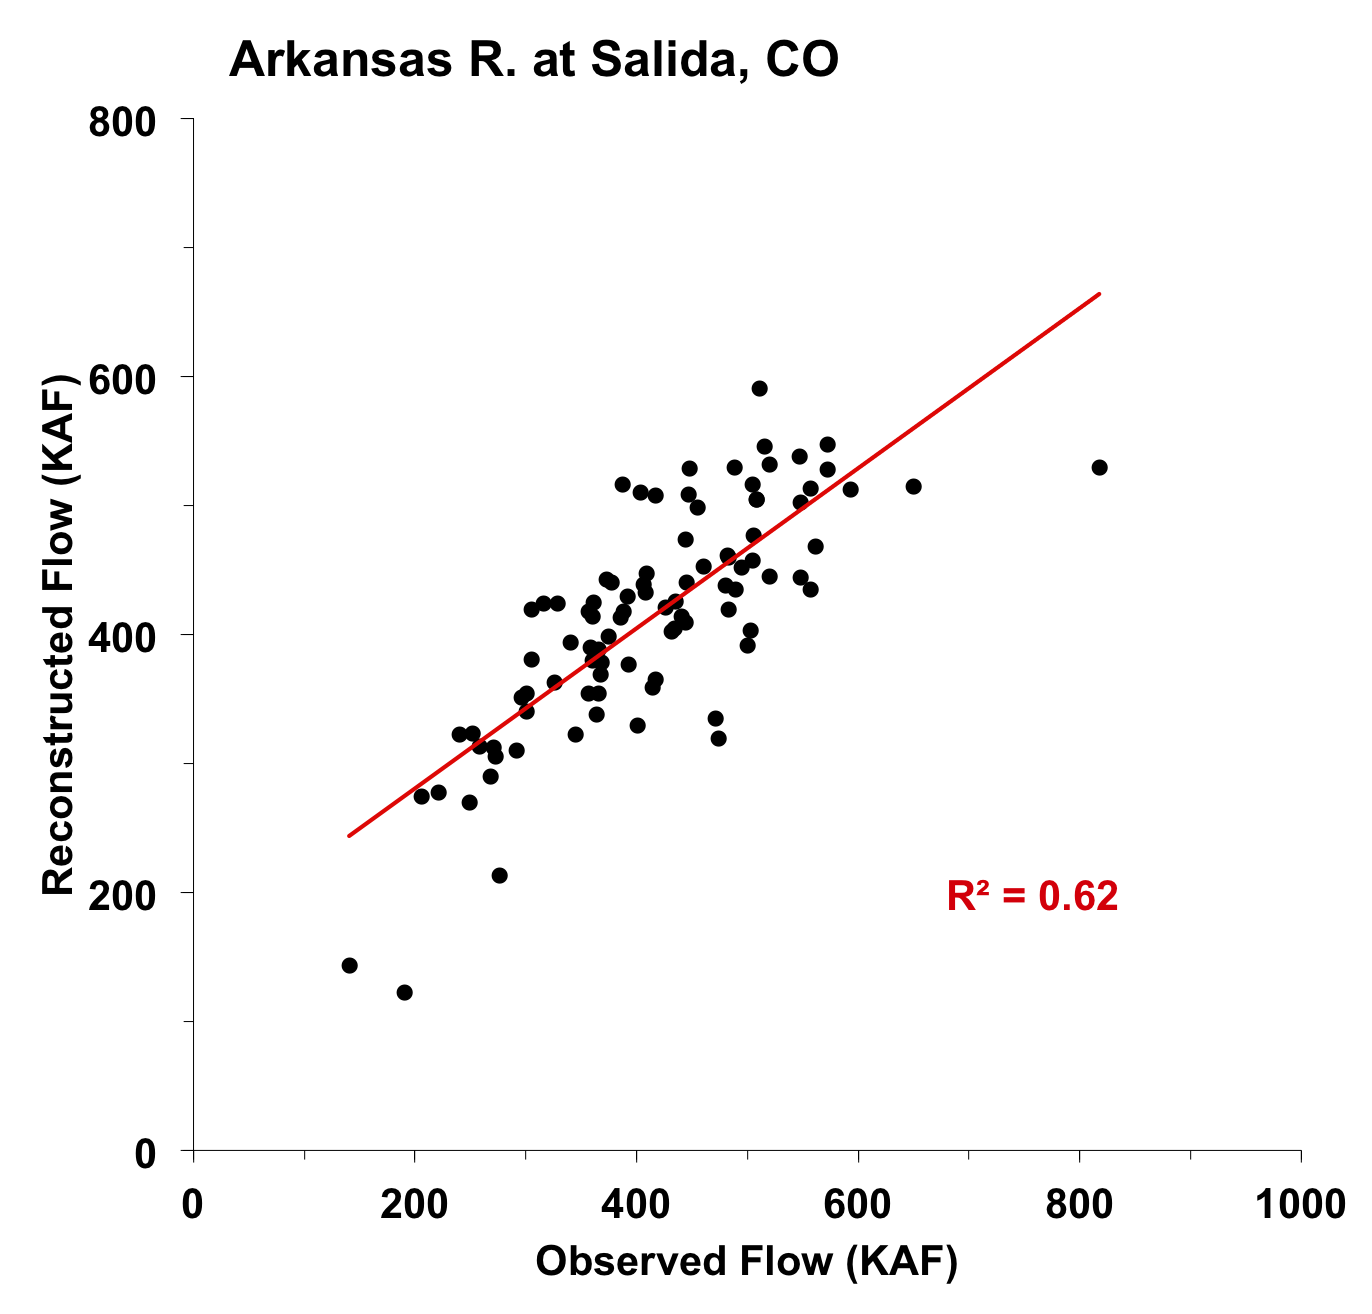
Figure 1. Scatter plot of observed and reconstructed Arkansas River annual flow, 1910-2003.

Figure 2. Observed (gray) and reconstructed (blue) Arkansas River annual flow, 1910-2003. The observed mean is illustrated by the dashed line.
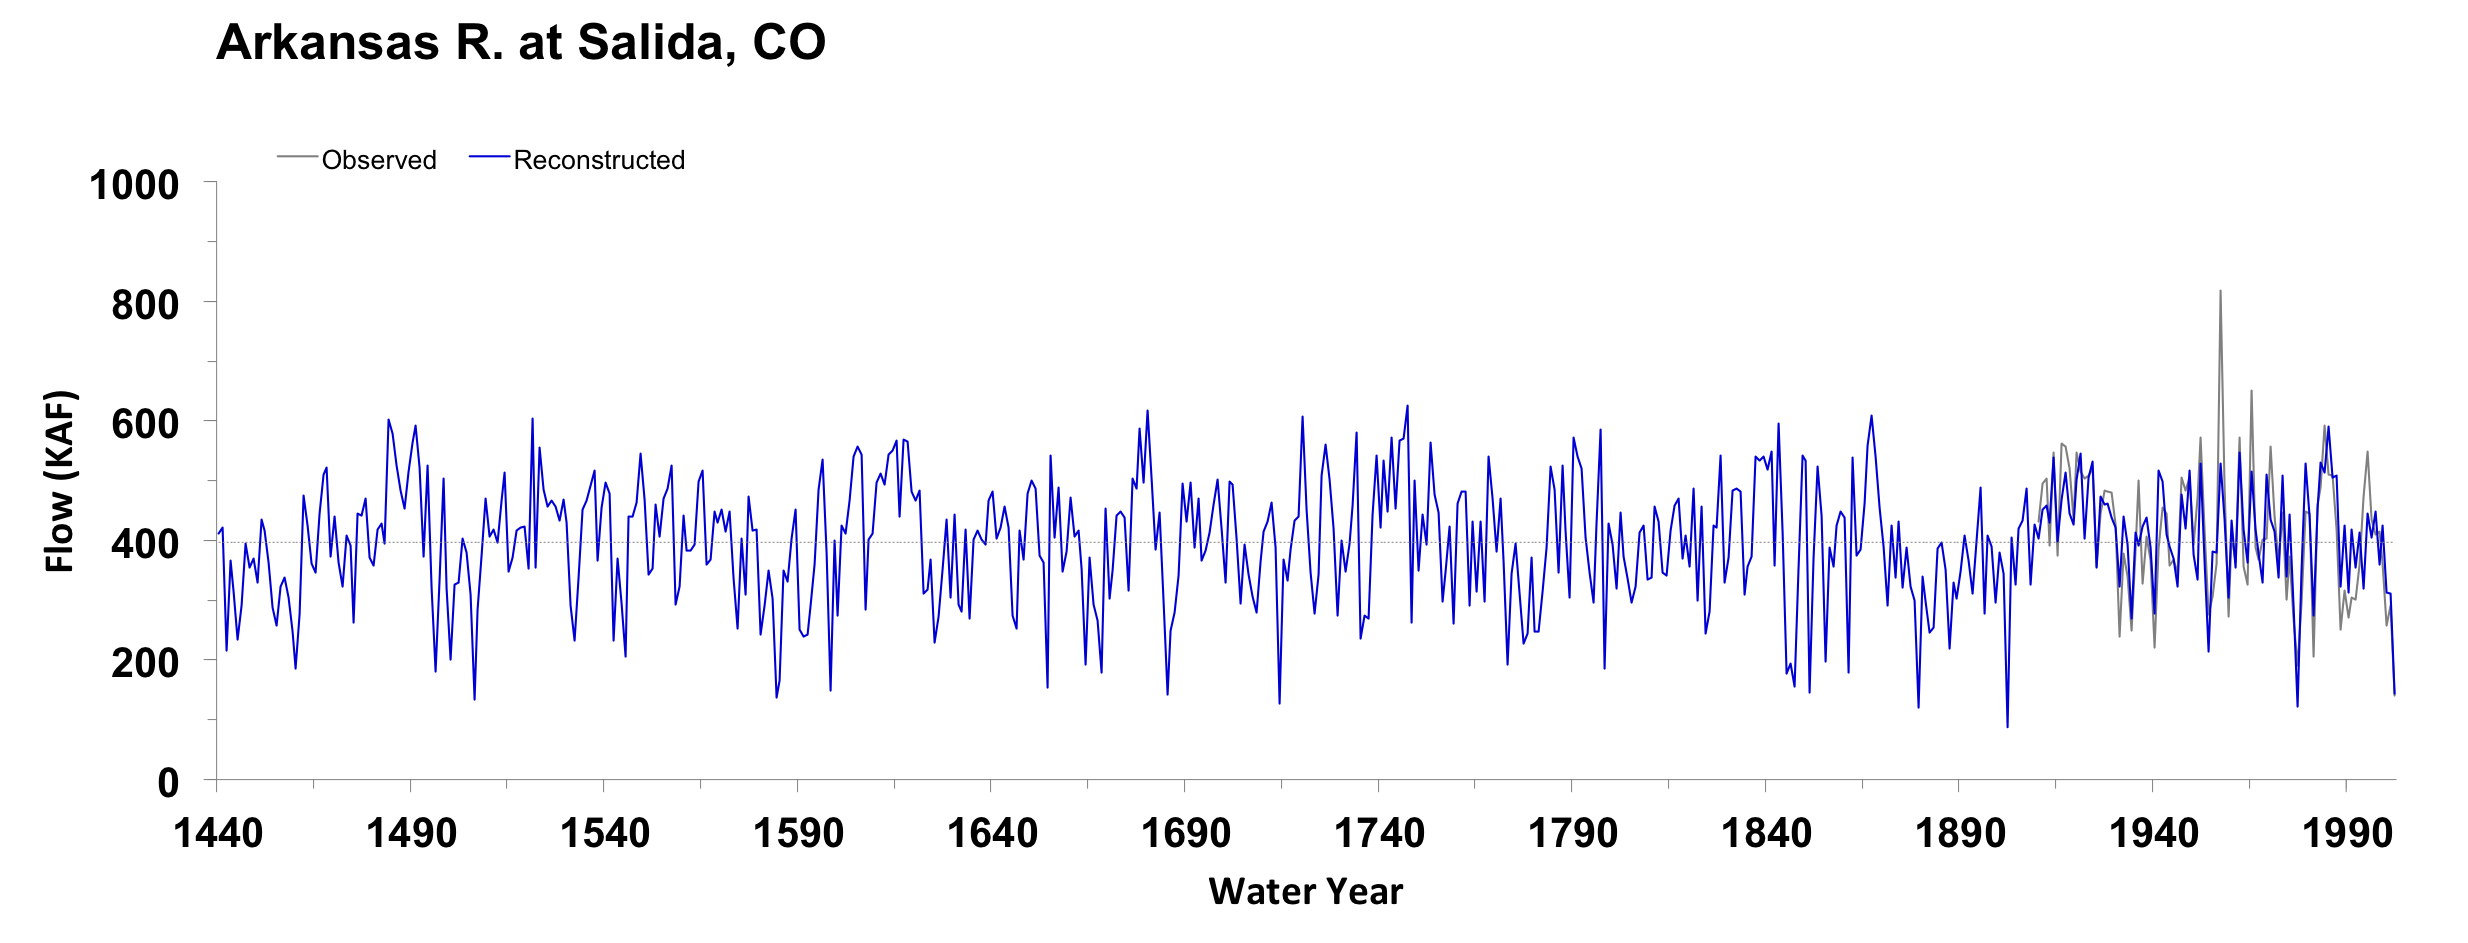
Figure 3. Reconstructed annual flow for the Arkansas River (1440-2002) is shown in blue. Observed flow is shown in gray and the long-term reconstructed mean is shown by the dashed line.
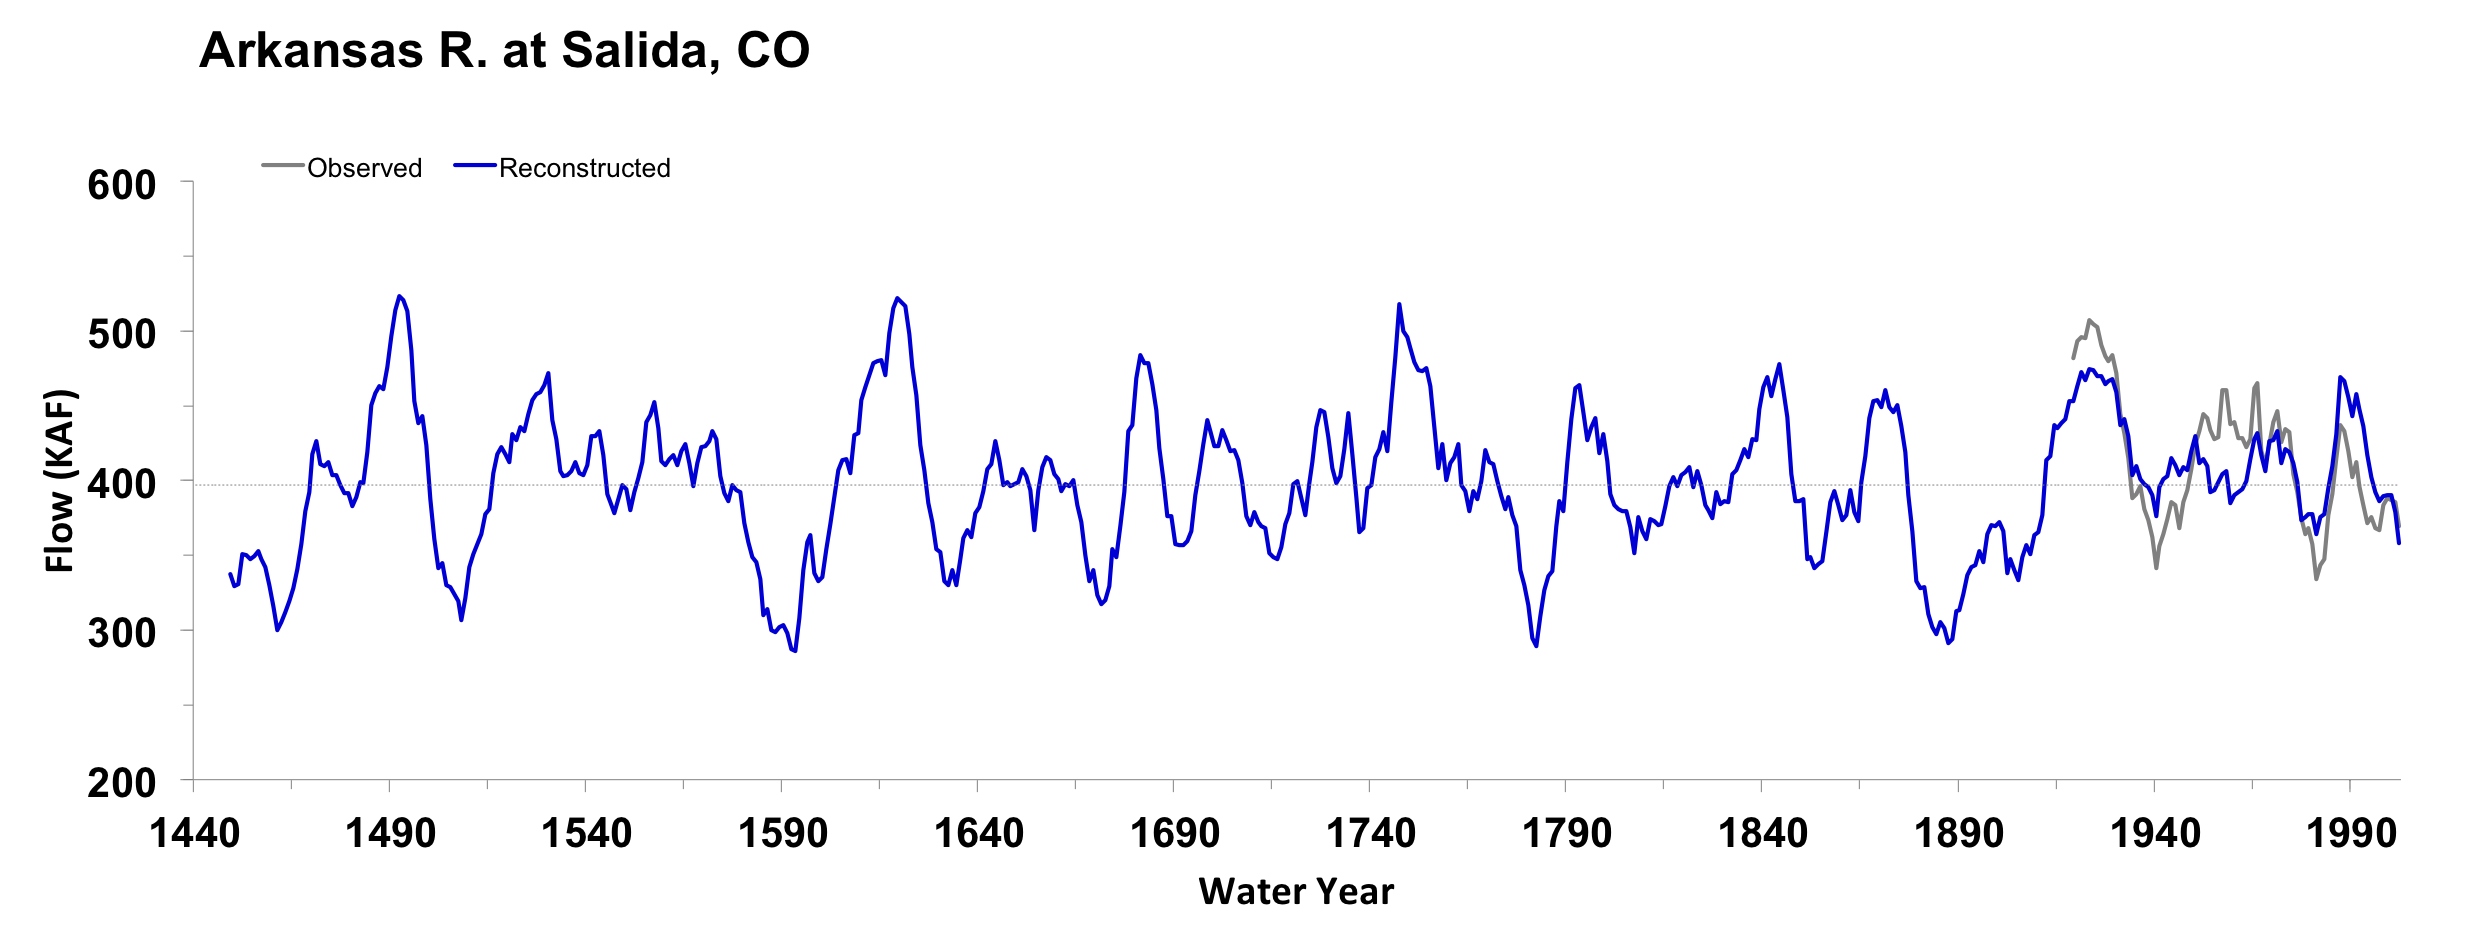
Figure 4. The 10-year running mean (plotted on final year) of reconstructed Arkansas River flow, 1440-2002. Reconstructed values are shown in blue and observed values are shown in gray. The long-term reconstructed mean is shown by the dashed line.

