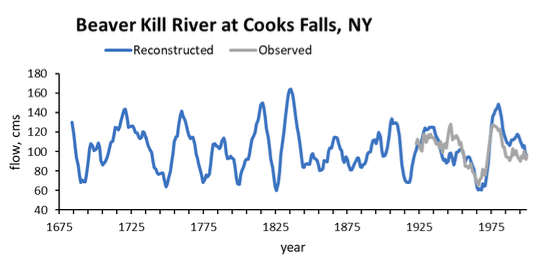
Beaver Kill River at Cooks Falls, NY
Tree-ring reconstructions of streamflow are uncommon in the eastern United States (US) compared to the western US. While the east has not experienced severe drought on the scale of the west over the last 100 years, multi-year droughts have stressed the water management systems throughout the east. Here, Maxwell and colleagues reconstruct mean May – September streamflow of three rivers serving population centers in the northeast (Beaver Kill River serving New York, NY), mid-Atlantic (Potomac River serving Washington, D.C., updated from Maxwell et al. 2011), and southeast (Flint River serving Atlanta, GA: see South Atlantic Gulf page) to demonstrate the efficacy of reconstructing streamflow in the eastern US. Their reconstruction models explained 40 – 61% of the variance in the instrumental record and passed verification tests in all basins during the period 1675 – 2000 CE. Droughts and pluvials showed some synchrony across all basins but the mid-Atlantic region acted as a hinge, sometimes behaving more like the northeast, and other times like the southeast. Climatic analyses suggest a relationship exists between the North Atlantic Subtropical High and reconstructed streamflow that influences the probability of drought and pluvial events. Given the many factors influencing tree growth in closed canopy systems, Maxwell et al. have shown that careful standardization of individual tree-ring series, nested regression models, and the use of multiple species can produce robust proxies of streamflow across the eastern seaboard.
Reference:
Maxwell, R.S., G.L. Harley, J.T. Maxwell, S.A. Rayback, N. Pederson, E.R. Cook, D.J. Barclay, W. Li, and J.A. Rayburn. 2017. An interbasin comparison of tree‐ring reconstructed streamflow in the eastern United States. Hydrological Processes 31, 2381–2394.
Calibration and Validation
Streamflow reconstructions for the Beaver Kill River, Potomac River, and Flint River were modeled with a network of published and unpublished tree-ring width chronologies using nested principal components regression analysis. For complete calibration/validation details, see Maxwell et al. 2017.
Beaver Kill River explained variance = 0.40
Figure 1
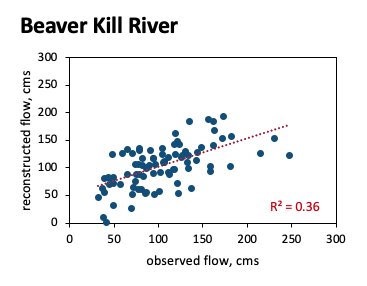
Figure 2
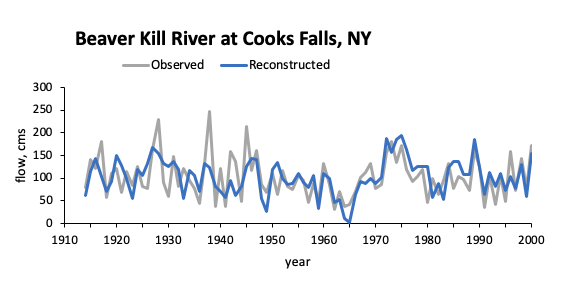
Figure 3