
Cache la Poudre River at Canyon Mouth, CO
The Cache la River (the "Poudre") is one of the larger tributaries of the South Platte. The Northern Colorado Water Conservancy District ("Northern"), which operates the Colorado-Big Thompson project, augments the Poudre with west-slope water and diverts it, to serve municipal and agricultural users in the lower Poudre basin, such as the city of Fort Collins. In 2002, Connie Woodhouse developed a tree-ring reconstruction of this gage and several others in Northern's east slope supply, and then in 2004, Woodhouse updated the Poudre reconstruction using more recently collected chronologies. The updated reconstruction is shown here. This reconstruction was used for the analyses in Woodhouse and Lukas (2006).
References:
Woodhouse, C.A. and J.J. Lukas. 2006. Multi-century tree-ring reconstructions of Colorado streamflow for water resource planning. Climatic Change 78: 293-315.
Methods
A forward stepwise regression procedure was used to calibrate the observed flow record with a pool of potential predictors consisting of tree-ring chronologies from Colorado (both east-slope and west-slope). The residual chronologies, with the low-order autocorrelation removed, were used. Eight predictor chronologies were selected by the stepwise procedure for the reconstruction model. Validation statistics were computed using a leave-one-out (cross-validation) approach.
Predictors: Pump House (CO), Owl Canyon Update (CO), Green Mountain Reservoir (CO), Escalante Forks Update (CO), Red Canyon (CO), Bennett Creek (CO), Johnny Park (CO), Big Thompson Update (CO)
| Statistic | Calibration | Validation |
| Explained variance (R2) | 0.64 | |
| Reduction of Error (RE) | 0.56 | |
| Standard Error of the Estimate | 63,550 AF | |
| Root Mean Square Error (RMSE) | 66,460 AF |
(For explanations of these statistics, see this document (PDF), and also the Reconstruction Case Study page.)
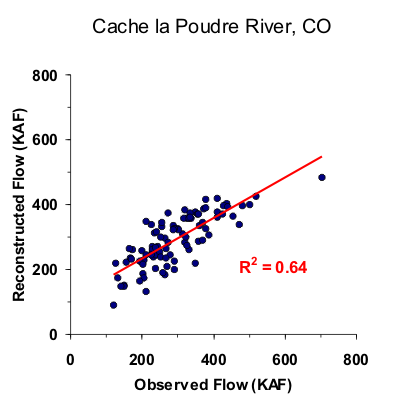
Figure 1. Scatterplot of observed and reconstructed Cache la Poudre River annual flow, 1906-1999.
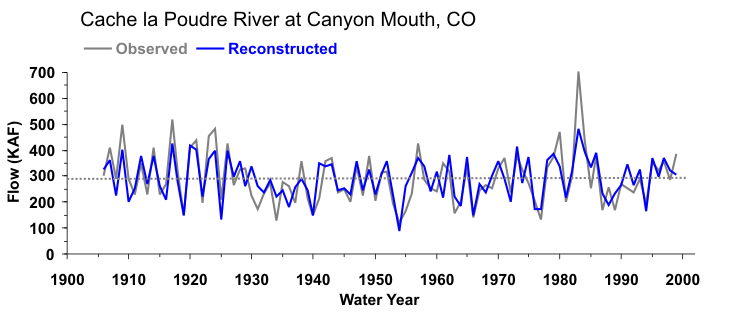
Figure 2. Observed (black) and reconstructed (blue) annual Cache la Poudre River annual flow, 1906-1999. The observed mean is illustrated by the dashed line.
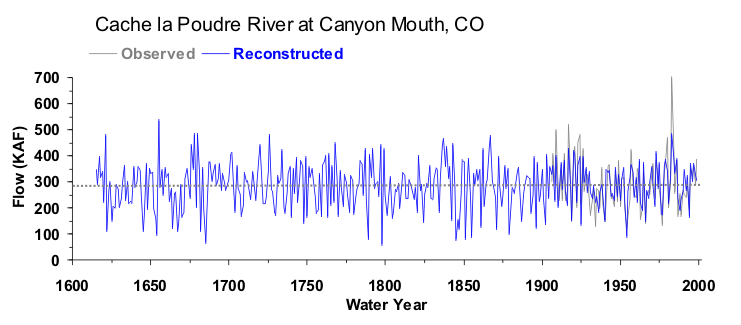
Figure 3. Reconstructed annual flow for the Cache la Poudre River (1615-1999) is shown in blue. Observed flow is shown in gray and the long-term reconstructed mean is shown by the dashed line.
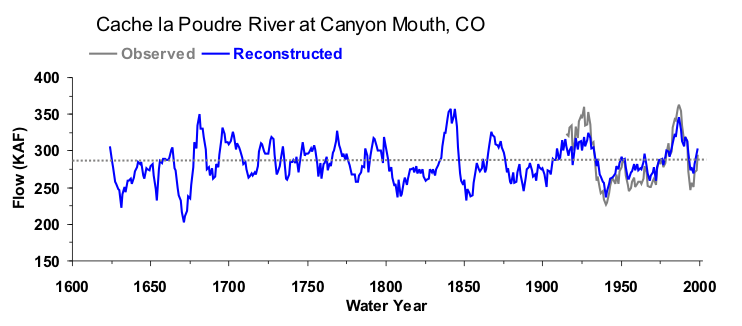
Figure 4. The 10-year running mean (plotted on final year) of reconstructed Cache la Poudre River flow, 1615-1999. Reconstructed values are shown in blue and observed values are shown in gray. The long-term reconstructed mean is shown by the dashed line.

