
Canadian River near Sanchez, NM
In November 2007, Connie Woodhouse, Jeff Lukas, and several colleagues held a workshop in Albuquerque, NM as the first stage of a NOAA-funded project to expand and improve the usability of tree-ring reconstructions for drought planning and water management in the Rio Grande basin and adjacent basins in New Mexico. Based on feedback from a workshop participant with the New Mexico Interstate Stream Commission, Dave Meko and Connie Woodhouse generated a reconstruction for the Canadian River near Sanchez, NM. This reconstruction, along with two reconstructions for the Rio Grande at Otowi Bridge, NM (1 - NRCS Flows, 2 - Natural Flows) were presented at a followup workshop in Albuquerque in May 2008.
Methods
Because the observed flow record for the Canadian River is highly skewed towards high flows, resulting in a non-linear relationship between the observed flow record and the tree-ring chronologies, the observed record was transformed into log 10 units prior to calibration. A forward stepwise regression procedure was then used to calibrate the log-transformed observed flow record with a pool of potential predictors consisting of tree-ring chronologies from Colorado and New Mexico. Five chronologies were selected by the stepwise procedure for the reconstruction model. Validation statistics were computed using a leave-one-out (cross-validation) approach. After calibration and validation, the reconstructed flows were back-transformed from log units to the original units (acre-feet).
Predictor Chronologies: Wet Mountains (CO), Montrose (CO), McPhee (CO), Disappointment Valley (CO), Mill Canyon (NM) [all residual chronologies except Mill Canyon]
Note: the calibration and validation statistics below were computed during the model development and reflect the relationship between the log-transformed observed flow record and the tree-ring predictor. The scatterplot below in Figure 1 shows the relationship between the back-transformed observed flows and the reconstructed flows, which have a lower R2. Also, the Standard Error of the Estimate and Root Mean Square Error reported below are in log units, and the RMSE can't be used to compute confidence intervals.
| Statistic | Calibration | Validation |
| Explained variance (R2) | 0.61 | |
| Reduction of Error (RE) | 0.51 | |
| Standard Error of the Estimate | 0.2360 | |
| Root Mean Square Error (RMSE) | 0.2523 |
(For explanations of these statistics, see this document (PDF), and also the Reconstruction Case Study page.)
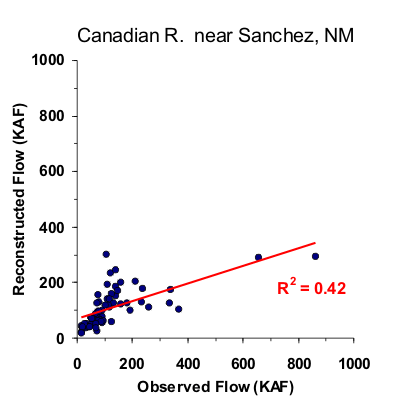
Figure 1. Scatter plot of observed and reconstructed Canadian River annual flow, 1937-1997.
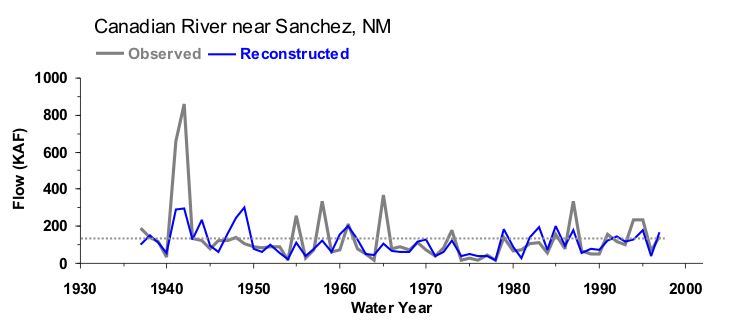
Figure 2. Observed (gray) and reconstructed (blue) Canadian annual flow, 1937-1997. The observed mean is illustrated by the dashed line.
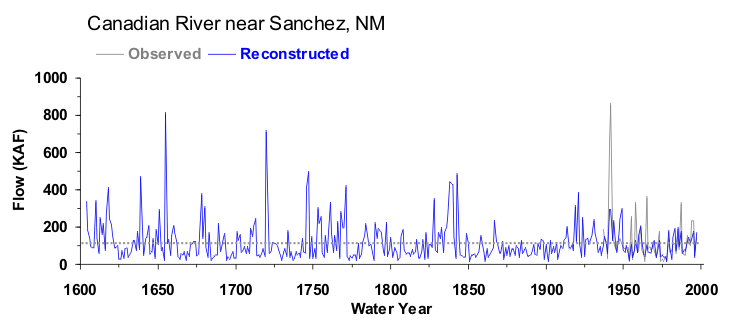
Figure 3. Reconstructed annual flow for the Canadian River (1604-1997) is shown in blue. Observed flow is shown in gray and the long-term reconstructed mean is shown by the dashed line.
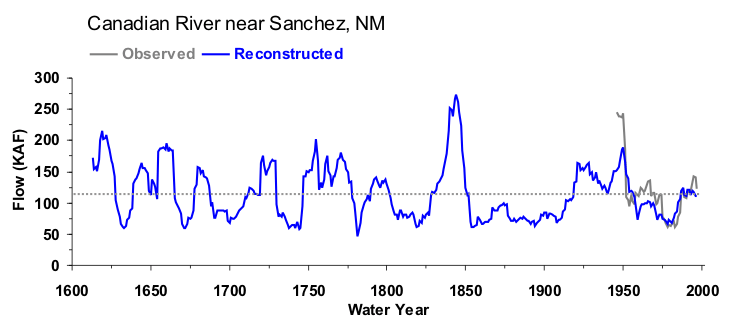
Figure 4. The 10-year running mean (plotted on final year) of reconstructed Canadian River flow, 1604-1997. Reconstructed values are shown in blue and observed values are shown in gray. The long-term reconstructed mean is shown by the dashed line.

