
Colorado River at Hot Sulphur Springs, CO
The headwaters of the Colorado River are diverted under the Continental Divide to the Front Range through several projects, the largest of which is the Colorado-Big Thompson (C-BT) project. The City of Boulder uses C-BT water for about 20% of its municipal water supply, and the Colorado River at Hot Sulphur Springs gage is a useful indicator of the conditions of the C-BT supply. In 2005, Jeff Lukas and Connie Woodhouse generated a tree-ring reconstruction of this gage for AMEC Earth & Environmental (formerly Hydrosphere), consultants for the City of Boulder.
References:
Woodhouse, C., and J. Lukas. Streamflow Reconstructions for Boulder Creek, South Boulder Creek, and the Colorado River. Report to City of Boulder and Hydrosphere Resource Consultants, January 2006.
Methods
A forward stepwise regression procedure was used to calibrate the observed flow record with a pool of potential predictors consisting of ~30 tree-ring chronologies from western Colorado and the Colorado Front Range. The residual chronologies, with the low-order autocorrelation removed, were used. Four predictor chronologies were selected by the stepwise procedure for the reconstruction model for the Colorado River at Hot Suplhur Springs. Validation statistics were computed using a leave-one-out (cross-validation) approach.
Predictor Chronologies: Pump House (CO), Dillon (CO), McPhee-Dolores (CO), Van Bibber Update (CO)
| Statistic | Calibration | Validation |
| Explained variance (R2) | 0.70 | |
| Reduction of Error (RE) | 0.67 | |
| Standard Error of the Estimate | 77,286 AF | |
| Root Mean Square Error (RMSE) | 79,602 AF |
(For explanations of these statistics, see this document (PDF), and also the Reconstruction Case Study page.)
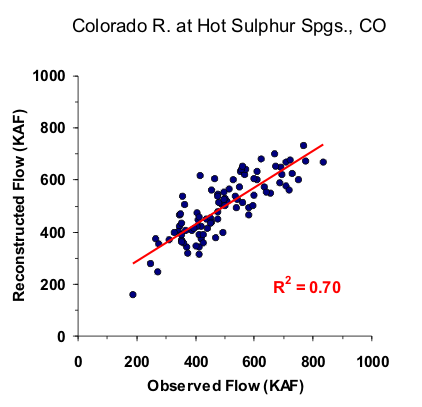
Figure 1. Scatter plot of observed and reconstructed Colorado River annual flow, 1907-2002.
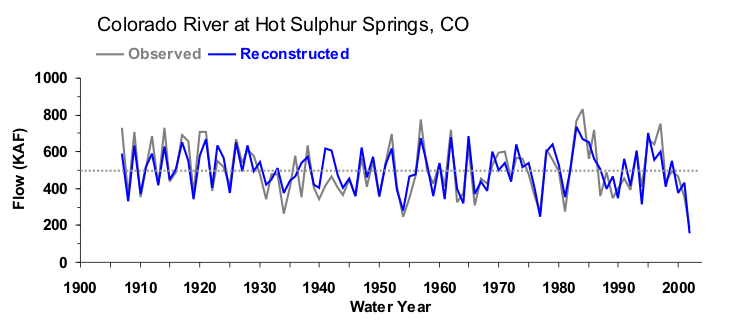
Figure 2. Observed (black) and reconstructed (blue) annual Colorado River annual flow, 1907-2002. The observed mean is illustrated by the dashed line.
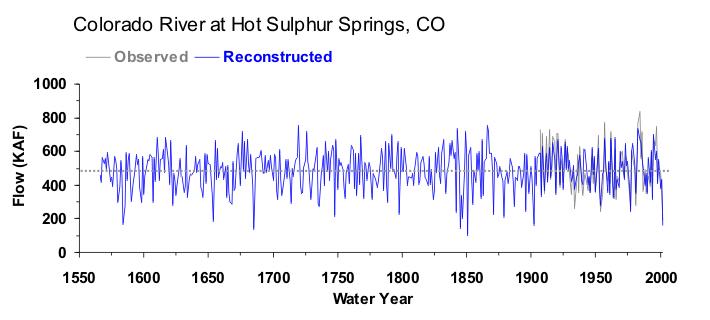
Figure 3. Reconstructed annual flow for the Colorado River (1566-2002) is shown in blue. Observed flow is shown in gray and the long-term reconstructed mean is shown by the dashed line.
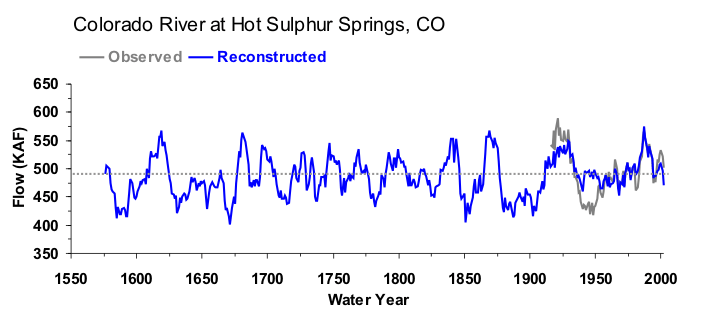
Figure 4. The 10-year running mean (plotted on final year) of reconstructed Colorado River flow, 1566-2002. Reconstructed values are shown in blue and observed values are shown in gray. The long-term reconstructed mean is shown by the dashed line.

