
Colorado River near Cisco, UT
In 2004 and 2005, Connie Woodhouse, Steve Gray, and David Meko (University of Arizona Laboratory of Tree-Ring Research), developed ten new gage reconstructions of streamflow for the Upper Colorado River Basin, including the critical Colorado River at Lees Ferry, AZ gage. These reconstructions were intended to update the work of Stockton and Jacoby (1976), who developed the first formal reconstruction streamflow for Lees Ferry and other key gages in the basin. (A detailed history of reconstructions for the Colorado River basin is provided in Colorado River Streamflow – A Paleo Perspective.) The new reconstructions by Woodhouse, Gray, and Meko were based on several dozen new tree-ring chronologies in Colorado, Wyoming, and Utah, that had been developed since 2000, allowing a much longer calibration period (90 years) than previous reconstructions for the basin.
Note: While the published paper on this work (Woodhouse et al. 2006) only depicts 4 of the 10 gage reconstructions, the full dataset accompanying the paper contains all 10 reconstructions (which all are archived in TreeFlow).
References:
Woodhouse, C.A., S.T. Gray, and D.M. Meko. 2006. Updated streamflow reconstructions for the Upper Colorado River basin. Water Resources Research 42(5): W05415
Methods
A total of 62 tree-ring chronologies in Colorado, Wyoming, and Utah spanning the common interval from 1600 to 1997 comprised the initial dataset for calibration. The residual chronologies, with the low-order autocorrelation removed, were used. The chronologies were then screened for significant correlations (p < 0.05) with the respective gage records. The resulting pool of potential predictors (ranging from 24 to 38 chronologies depending on the gage) was calibrated with the gage record using a forward stepwise regression procedure. Validation statistics were computed using split-sample, leave-one-out, and linear neural network approaches; the statistics reported here are from the leave-one-out approach. The sensitivity of the resulting reconstruction for each gage was assessed by using several other reconstruction model approaches.
Woodhouse et al. (2006) describe the methods in greater detail, including the use of the variant modeling approaches to test reconstruction robustness to modeling choices. The versions of the reconstructions archived in TreeFlow (“full-pool” for all but Lees Ferry, and “Lees-A” for Lees Ferry) were judged by the authors to be the best for replicating the characteristics of the observed record.
Predictor Chronologies: Trail Gulch (CO), Wild Rose (CO), Dutch John Mtn. (UT), Dillon (CO), Red Creek (CO)
| Statistic | Calibration | Validation |
| Explained variance (R2) | 0.77 | |
| Reduction of Error (RE) | 0.73 | |
| Standard Error of the Estimate | 975,199 AF | |
| Root Mean Square Error (RMSE) | 1,012,319AF |
(For explanations of these statistics, see this document (PDF), and also the Reconstruction Case Study page.)
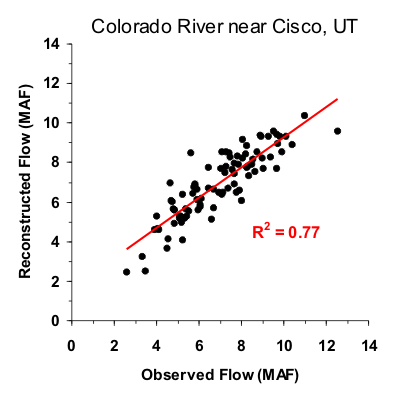
Figure 1. Scatter plot of observed and reconstructed Colorado River annual flow, 1906-1995.
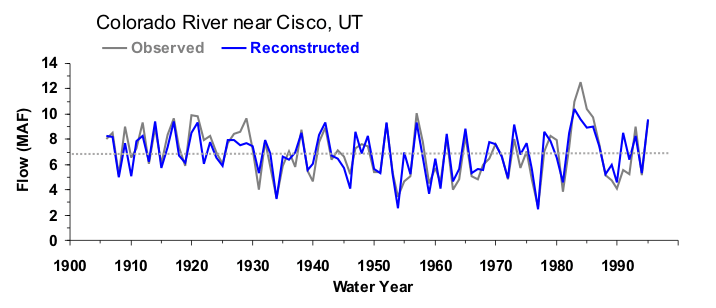
Figure 2. Observed (black) and reconstructed (blue) annual Colorado River annual flow, 1906-1995. The observed mean is illustrated by the dashed line.
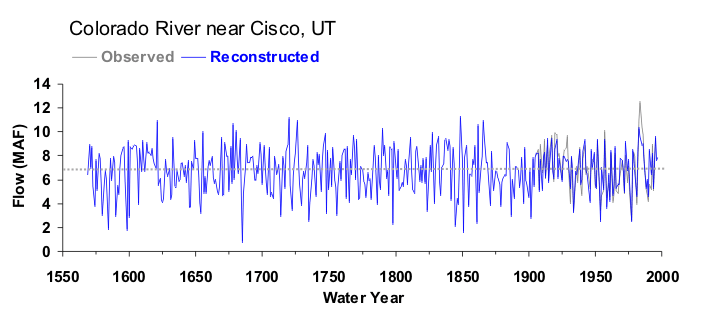
Figure 3. Reconstructed annual flow for the Colorado River flow (1569-1997) is shown in blue. Observed flow is shown in gray and the long-term reconstructed mean is shown by the dashed line.
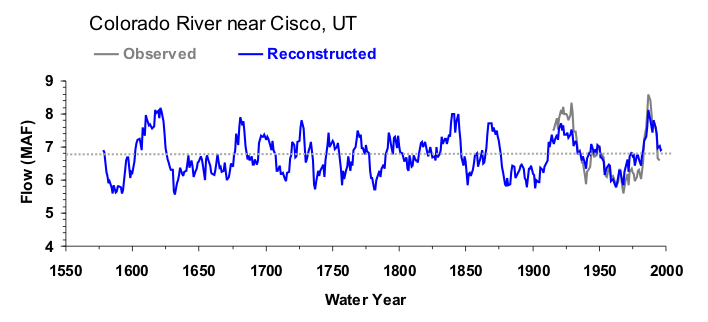
Figure 4. The 10-year running mean (plotted on final year) of reconstructed Colorado River flow, 1569-1997. Reconstructed values are shown in blue and observed values are shown in gray. The long-term reconstructed mean is shown by the dashed line.

