
Colorado River near Granby, CO
The Northern Colorado Water Conservancy District ("Northern") operates the Colorado-Big Thompson (C-BT) project, which collects water from the headwaters of the Colorado River and diverts it through the Adams Tunnel for delivery to municipal and agricultural users in northeastern Colorado. Four gages in the Colorado headwaters (Colorado R. near Granby, Fraser R. at Granby, Willow Creek Reservoir inflow, and Blue R. above Green Mountain Reservoir) are used by Northern to monitor and model the west-slope water supply for C-BT. In 2002, Connie Woodhouse generated tree-ring reconstructions of these four gages for Northern as part of the Colorado TreeFlow project. These reconstructions were also used in analyses for Woodhouse and Lukas (2006).
References:
Woodhouse, C.A. and J.J. Lukas. 2006. Multi-century tree-ring reconstructions of Colorado streamflow for water resource planning. Climatic Change 78: 293-315.
Methods
A forward stepwise regression procedure was used to calibrate the observed flow record with a pool of potential predictors consisting of 25 tree-ring chronologies from western Colorado. The residual chronologies, with the low-order autocorrelation removed, were used. Three predictor chronologies were selected by the stepwise procedure for the reconstruction model for the Colorado River near Granby. Validation statistics were computed using a leave-one-out (cross-validation) approach. See Woodhouse and Lukas (2006) for more details.
Predictor Chronologies: Pump House (CO), Cathedral Creek (CO), Green Mountain Reservoir (CO)
| Statistic | Calibration | Validation |
| Explained variance (R2) | 0.67 | |
| Reduction of Error (RE) | 0.59 | |
| Standard Error of the Estimate | 42,228 AF | |
| Root Mean Square Error (RMSE) | 43,898 AF |
(For explanations of these statistics, see this document (PDF), and also the Reconstruction Case Study page.)
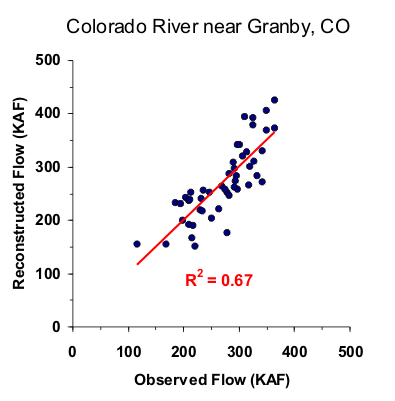
Figure 1. Scatter plot of observed and reconstructed Colorado River annual flow, 1951-1999.
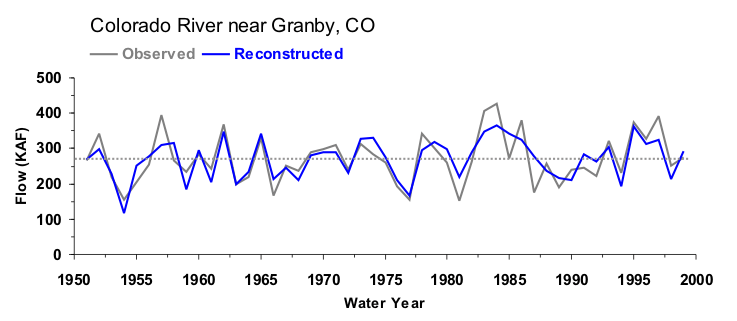
Figure 2. Observed (black) and reconstructed (blue) Colorado River annual flow, 1951-1999. The observed mean is illustrated by the dashed line.
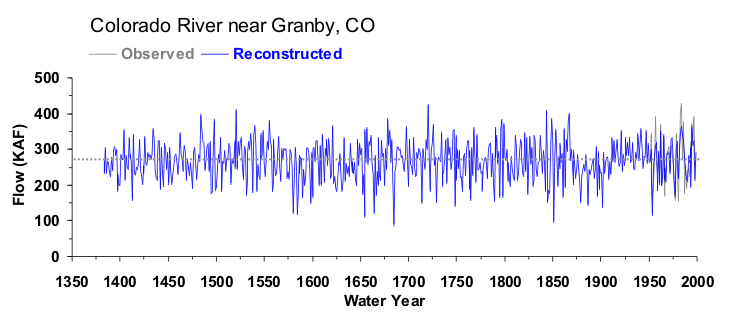
Figure 3. Reconstructed annual flow for the Colorado River (1383-1999) is shown in blue. Observed flow is shown in gray and the long-term reconstructed mean is shown by the dashed line.
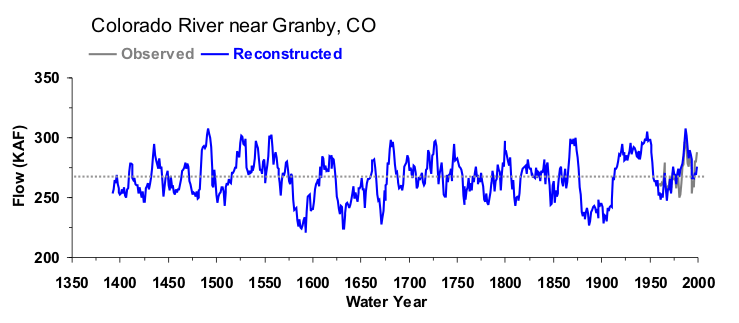
Figure 4. The 10-year running mean (plotted on final year) of reconstructed Colorado River flow, 1383-1999. Reconstructed values are shown in blue and observed values are shown in gray. The long-term reconstructed mean is shown by the dashed line.

