
Columbia River at Dalles
The Columbia River headwater flows from American Pacific Northwest to the Pacific coast of the United States, including portions of British Columbia, Washington, Oregon, Idaho, Nevada, Utah, Wyoming, and Montana. The Columbia River basin carries approximately 55% of total runoff from the region. Regional agriculture, power, transportation, fisheries and municipalities rely on Columbia River water. Reservoir storage capacity in the basin is approximately 30% of annual flow. While the average annual volume is relatively high, this proportionally limited storage capacity highlights the potential vulnerability of water resources management systems to hydrologic variability and extreme events.
Jeremy Littell and colleagues at the United States Geological Survey, the University of Idaho, the University of Notre Dame, and the University of Arizona used existing, updated and new chronologies to generate streamflow reconstructions for the Columbia River gage record at Dalles, OR. The result is two water year flow reconstructions: 1502 to 1990, and 1637 to1980, based on different calibration approaches.
References:
Methods
For the 1502-1990 model, a forward stepwise regression procedure was used to calibrate the naturalized Columbian River flow record using a pool of potential predictors consisting of standard tree-ring chronologies from Pacific Northwest. Chronologies in the pool were screened for length and correlation with basin hydroclimate. The final pool included both lagged and unlagged chronologies and resulted in 82 potential predictors for a model starting in 1650, and 61 for a model starting in 1550. For both models, five predictor chronologies were selected by the stepwise procedure for each of the two reconstruction models (three were in both models). Reconstructions from these two models were merged to create a 1502-1990 reconstruction. For the 1637-1983 model, principle components analysis (PCA) was used to reduce the pool of chronologies into PCs that preserved the seasonal information in the tree-ring chronologies. PC reflecting dominant modes of tree-growth/climate responses, as well as the PC time series lagged, were then used in a forward stepwise regression.
In both approaches, two forms of model cross-validation were used, PRESS and split-sample tests. See Littell et al. (2016) for more details.
Predictor Chronologies:
1609 model: Pintler 1 (CPL), Mt Jefferson High, Mt St. Helens (wa081), Sand Pass (id010), and Grizzly Bear (or030).
1502 model: Grizzly Bear (or030), Sand Pass (id010), Pintler 1 (CPL), Lane Plateau (or087), and Whirlpool Point (cana220).
1637 model: Refer to Littell et al. 2016 for chronologies used in the EOF/PC model.
| Statistic | Calibration | Validation |
| Explained variance (R2) | 0.59 | |
| Reduction of Error (RE) | 0.50 | |
| Standard Error of the Estimate | 1169 cms | |
| Root Mean Square Error (RMSE) | 724 cms |
(For explanations of these statistics, see this document (PDF), and also the Reconstruction Case Study page.)
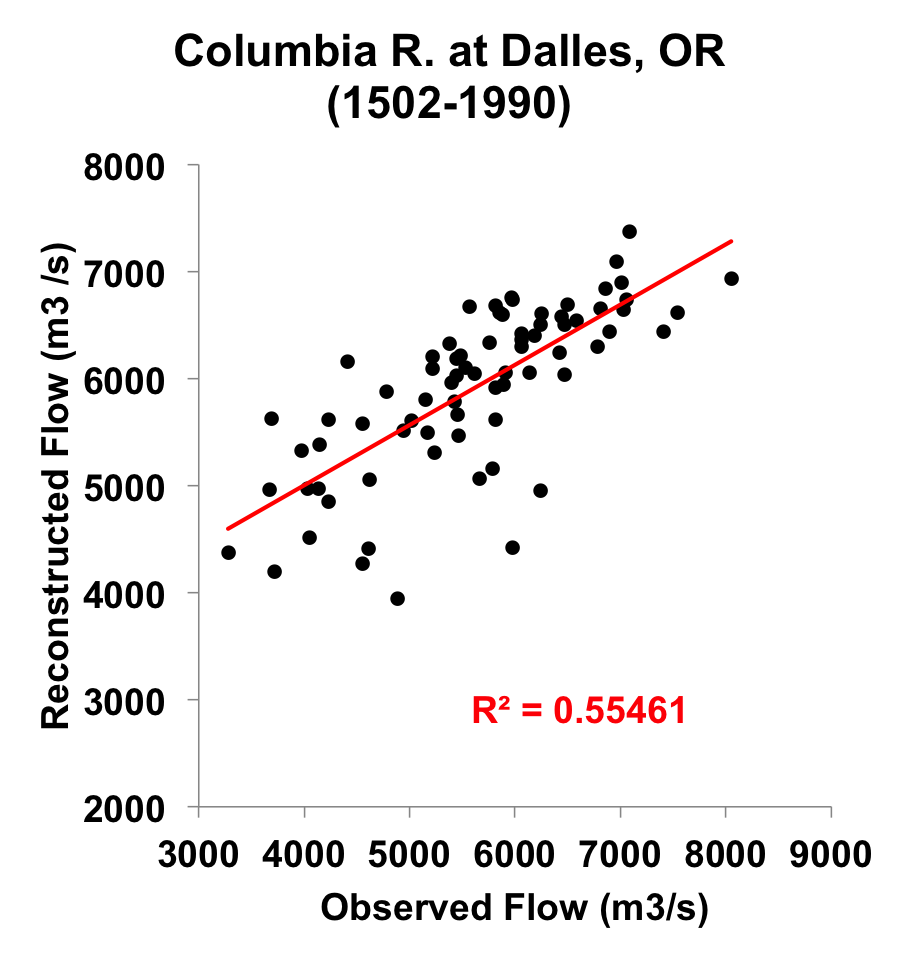
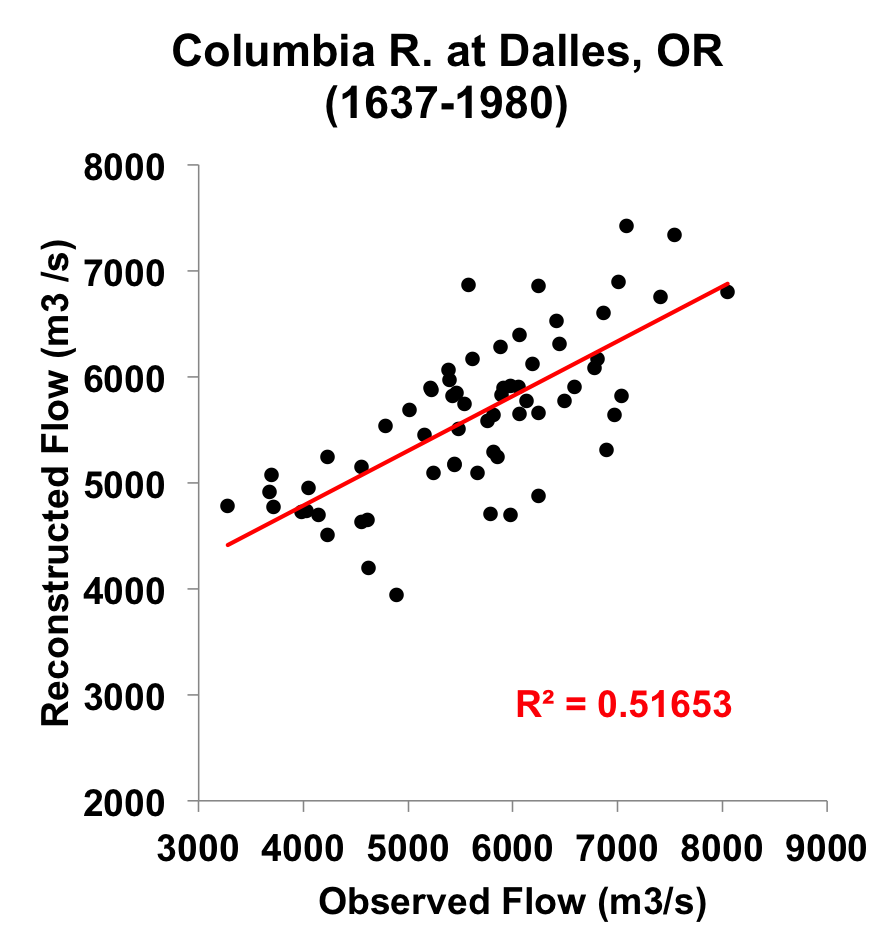
Figure 1. Scatter plots of observed and reconstructed Columbia River flow for water years (1502-1990) and (1637-1980).
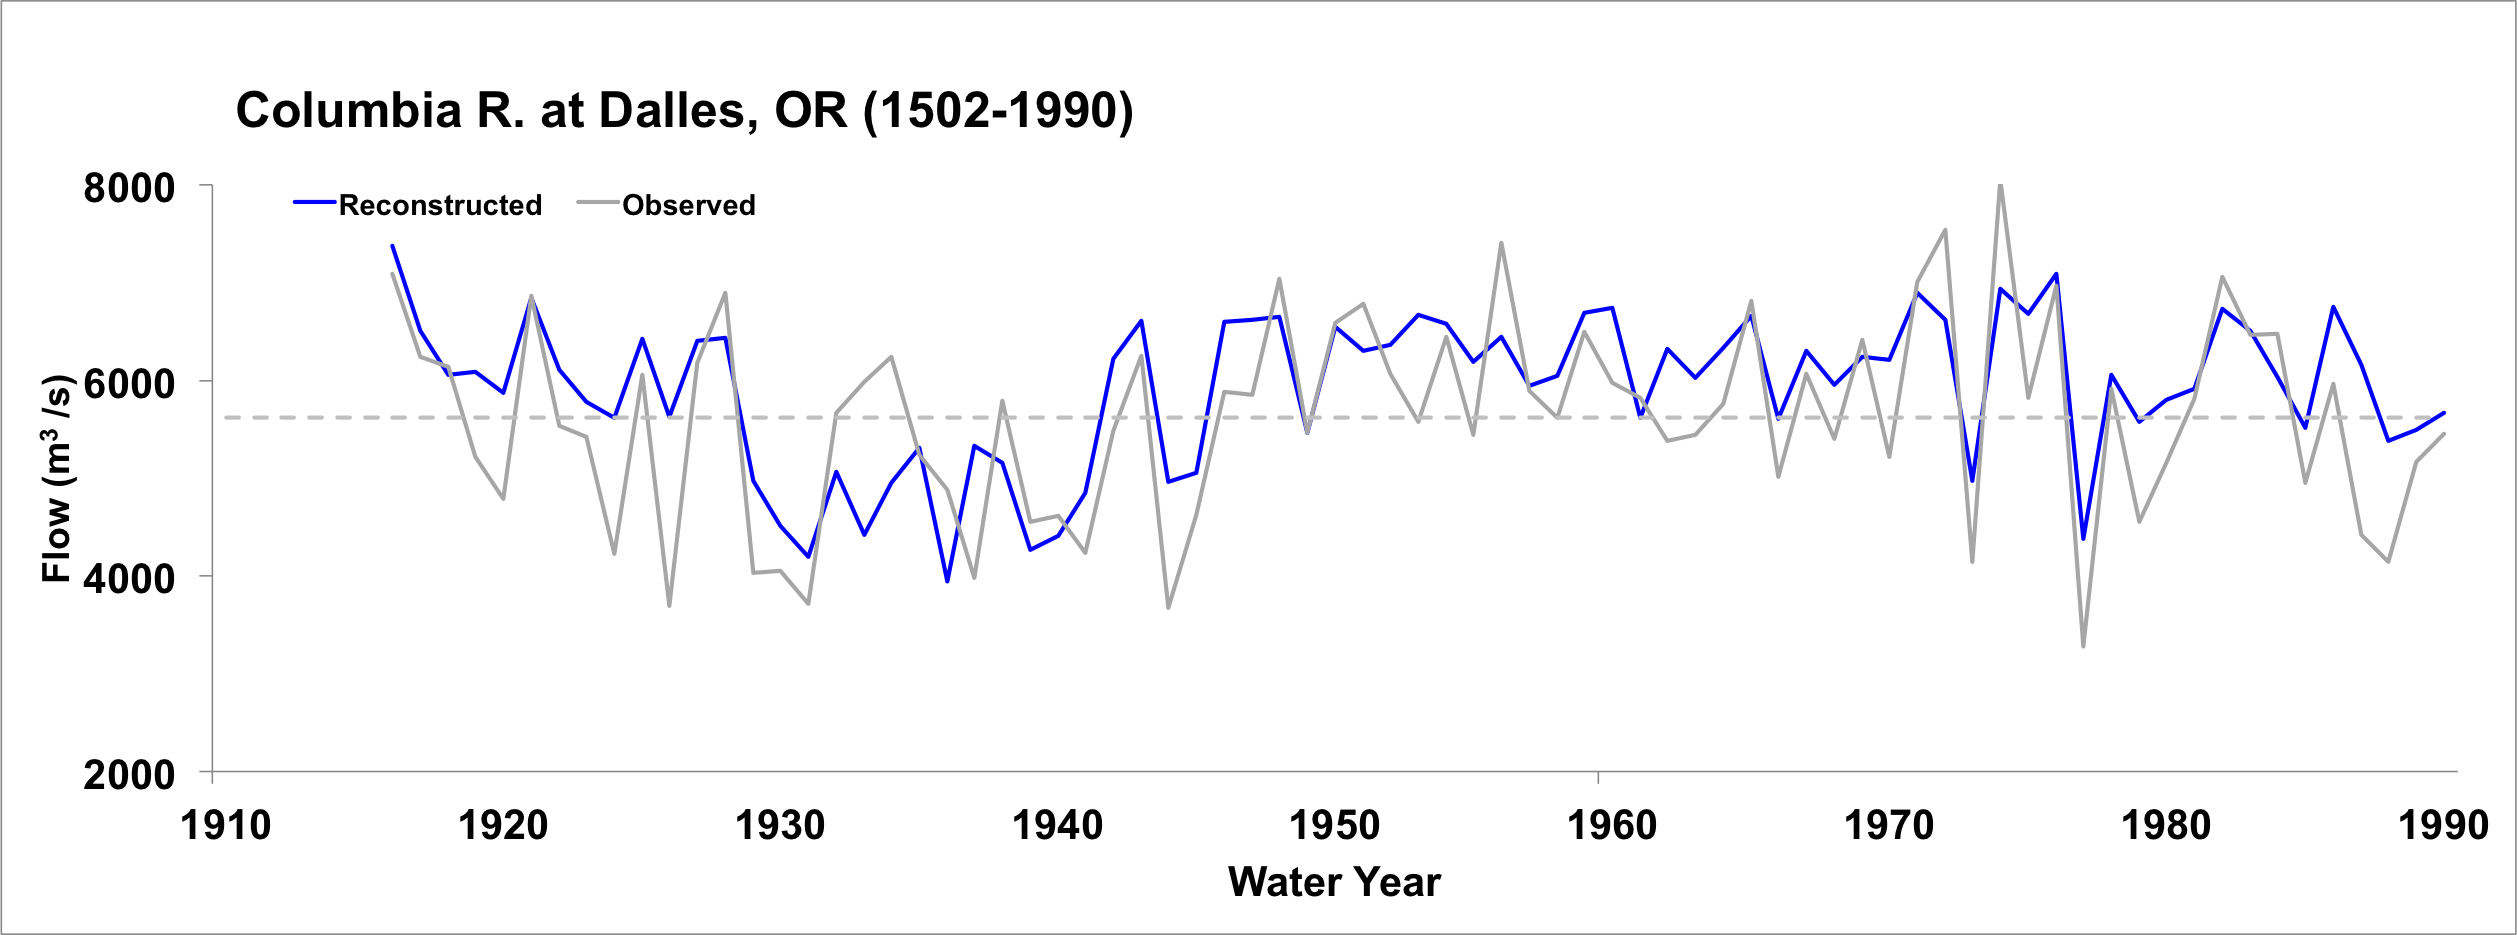
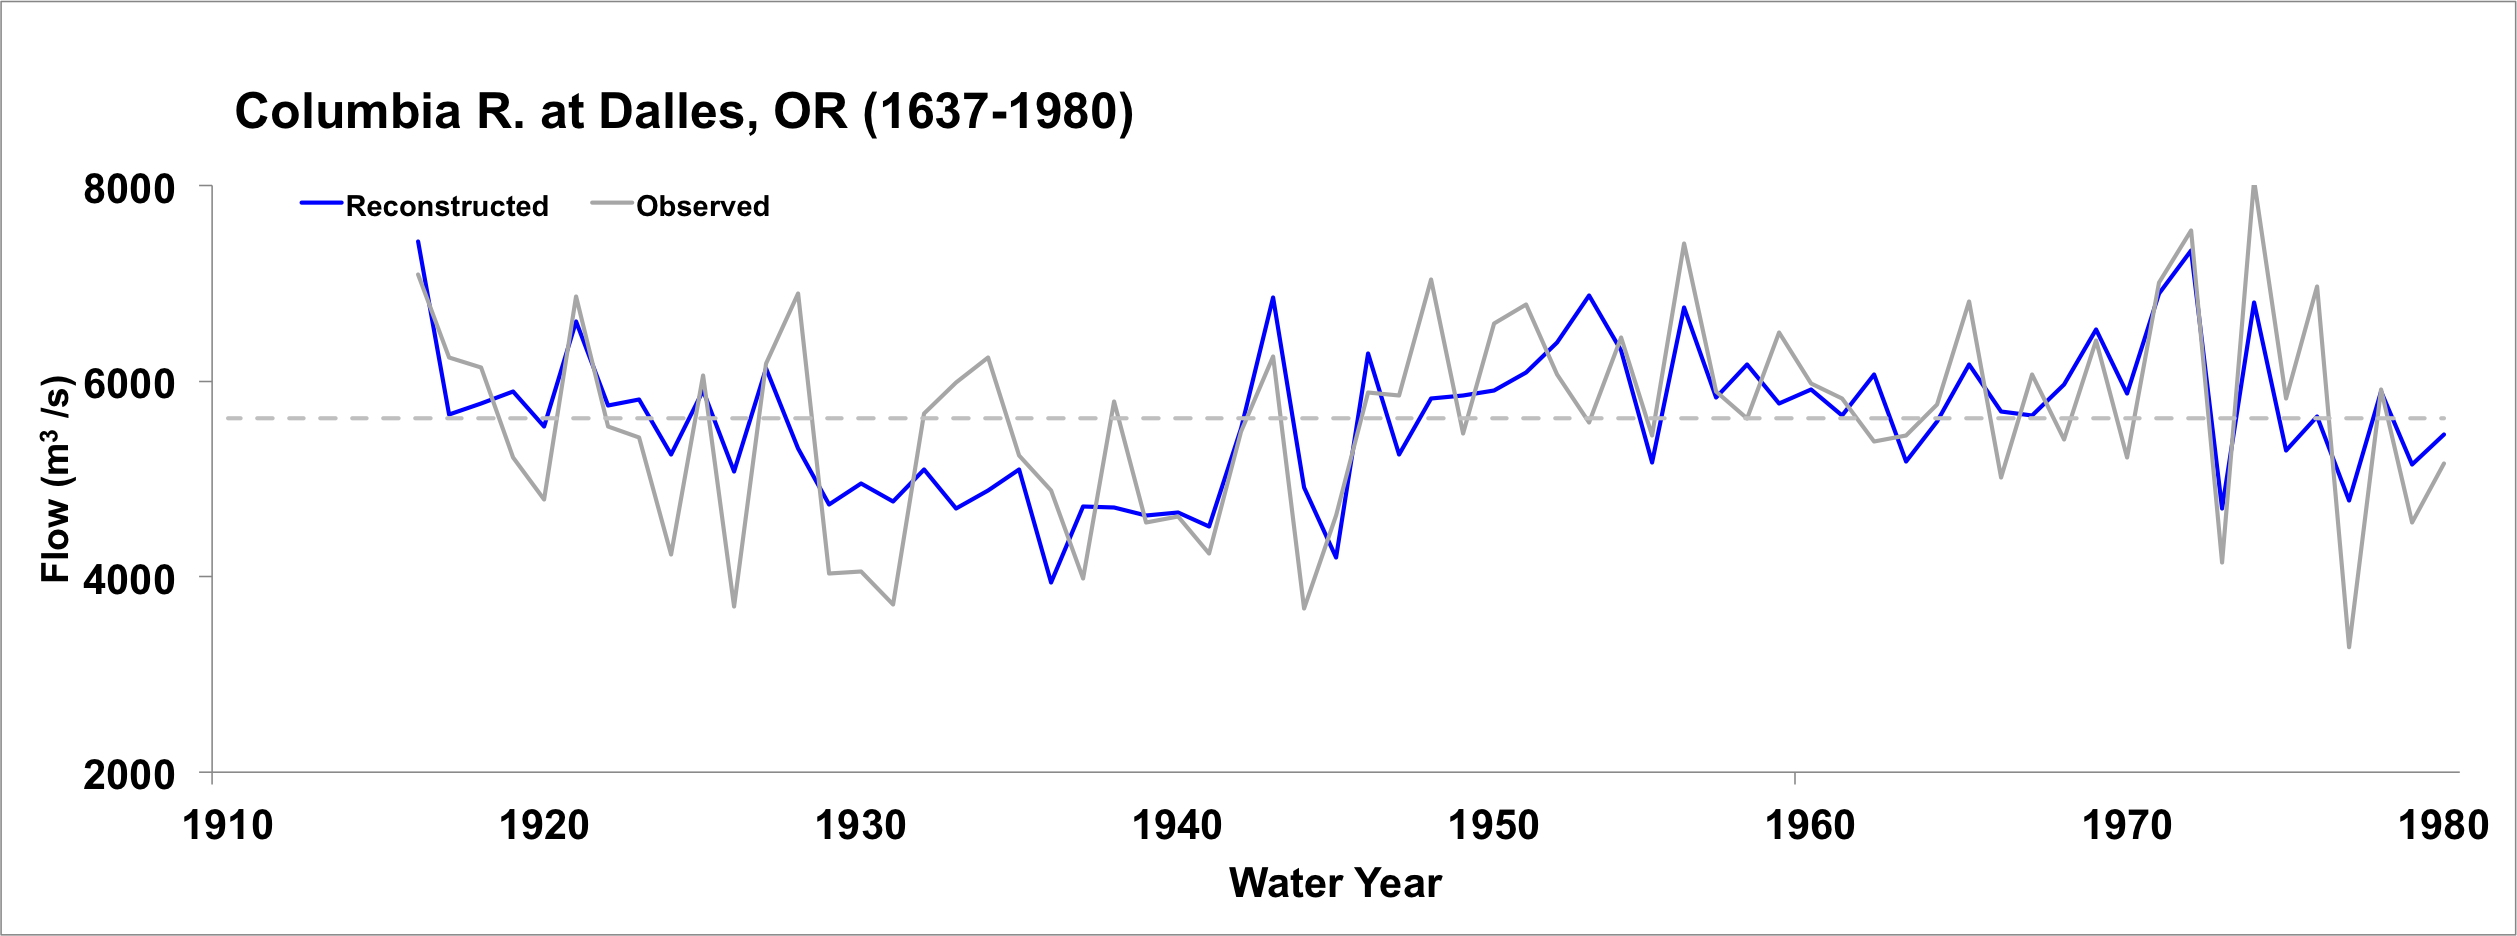
Figure 2. Observed (black) and reconstructed (blue) Columbia River annual flow, upper graph (1916-1990), lower graph (1916-1980). The observed mean is illustrated by the dashed line.
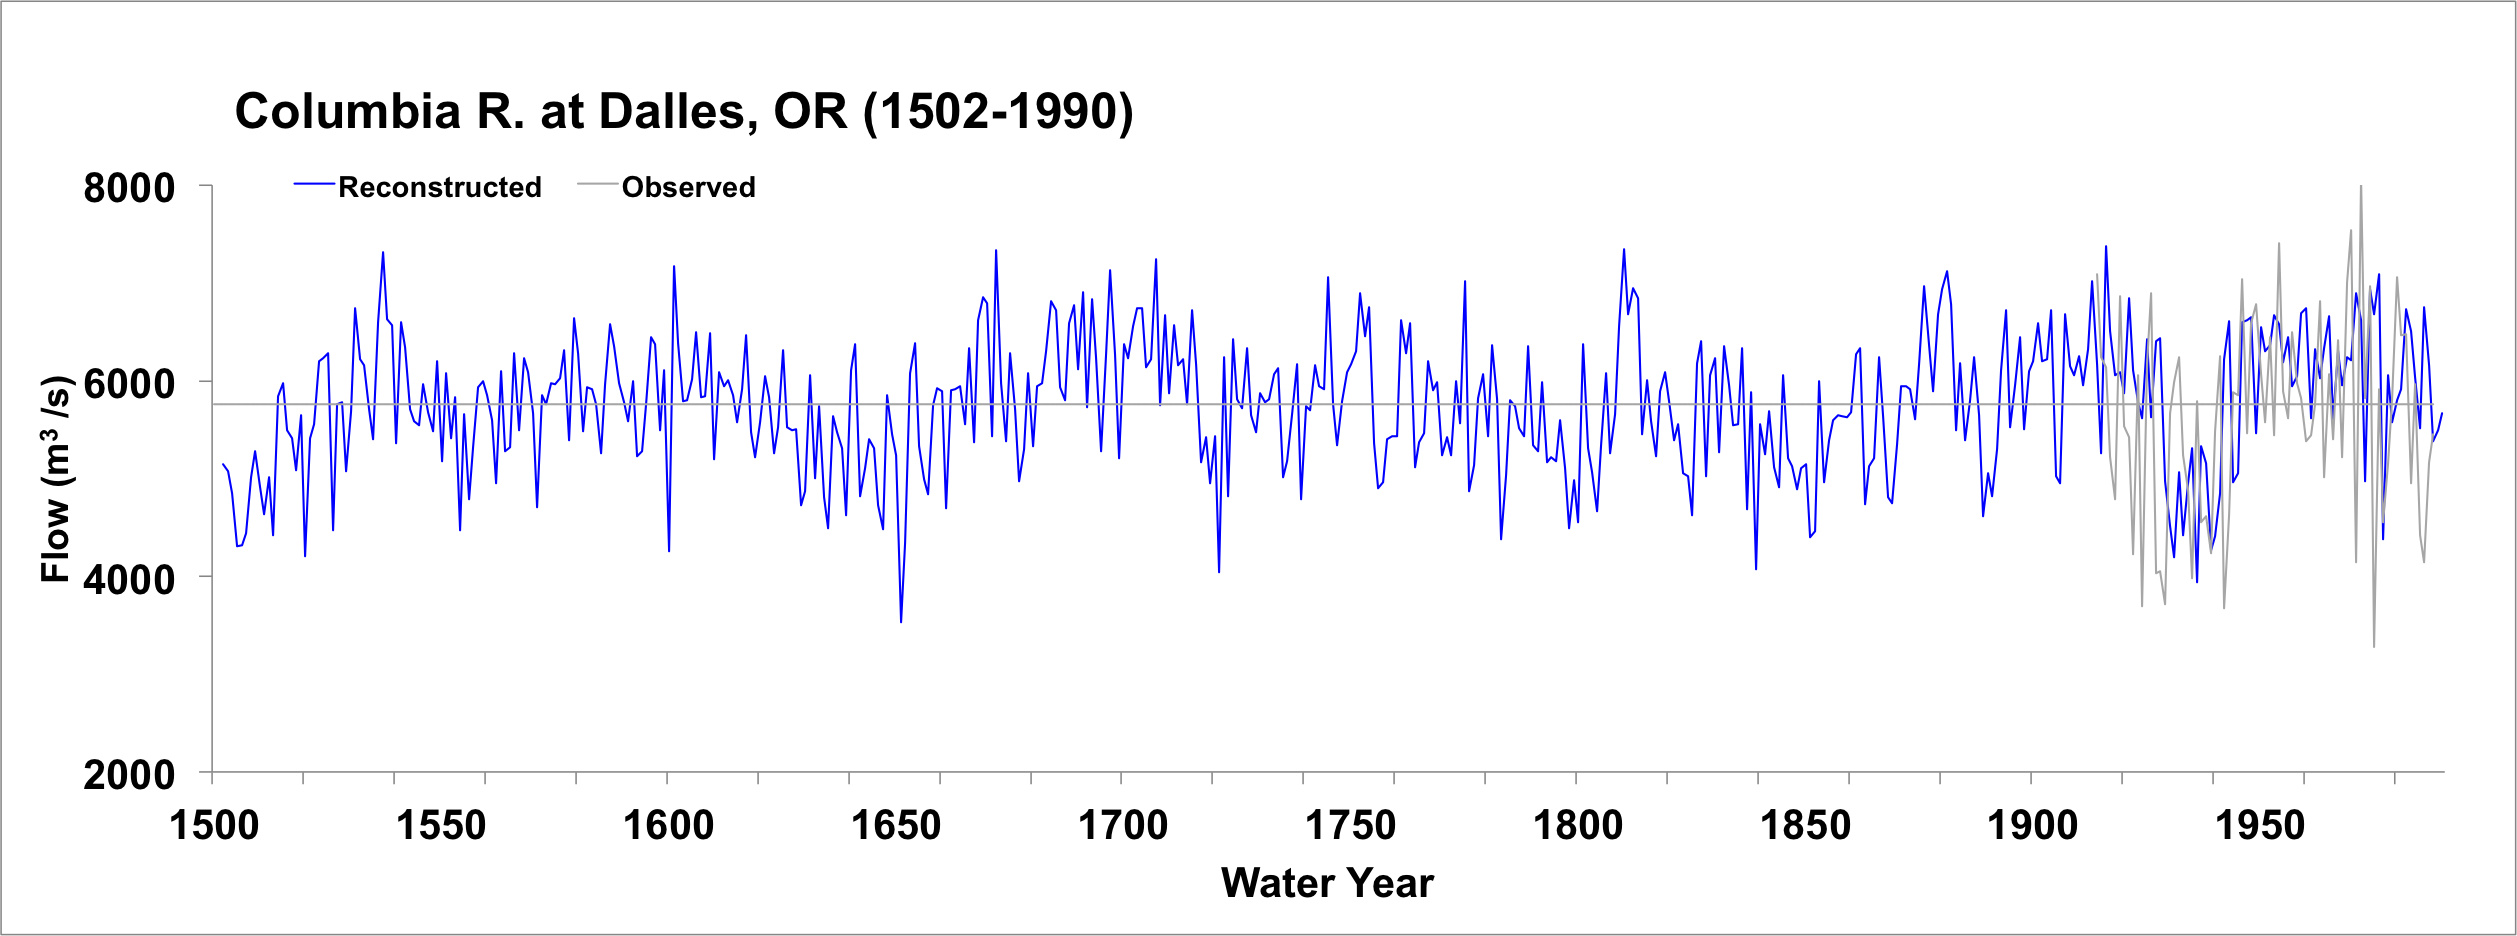
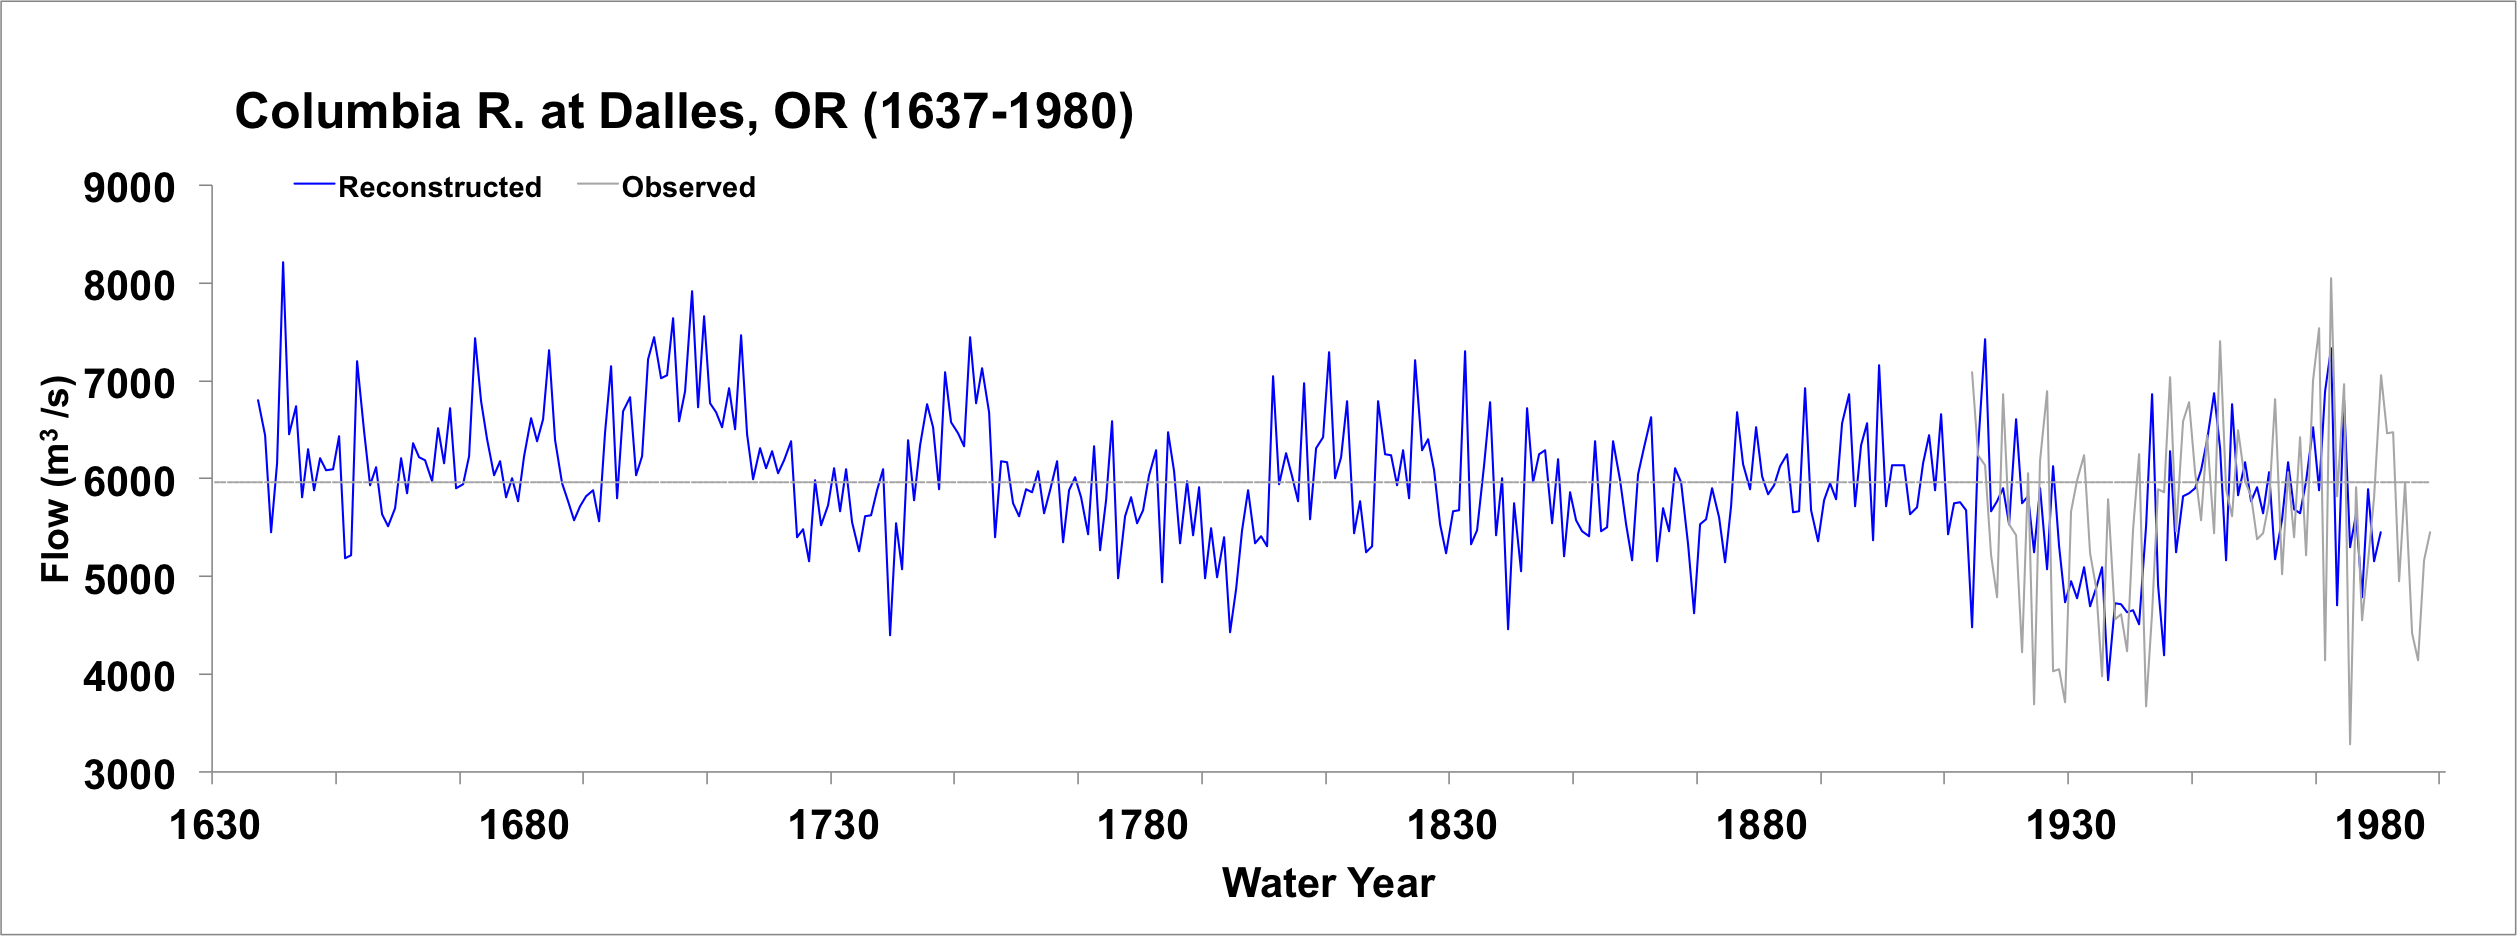
Figure 3. Reconstructed annual flow for the Columbia River flow (1502-1990) and (1637-1980) is shown in blue. Observed flow is shown in gray and the long-term reconstructed mean is shown by the dashed line.
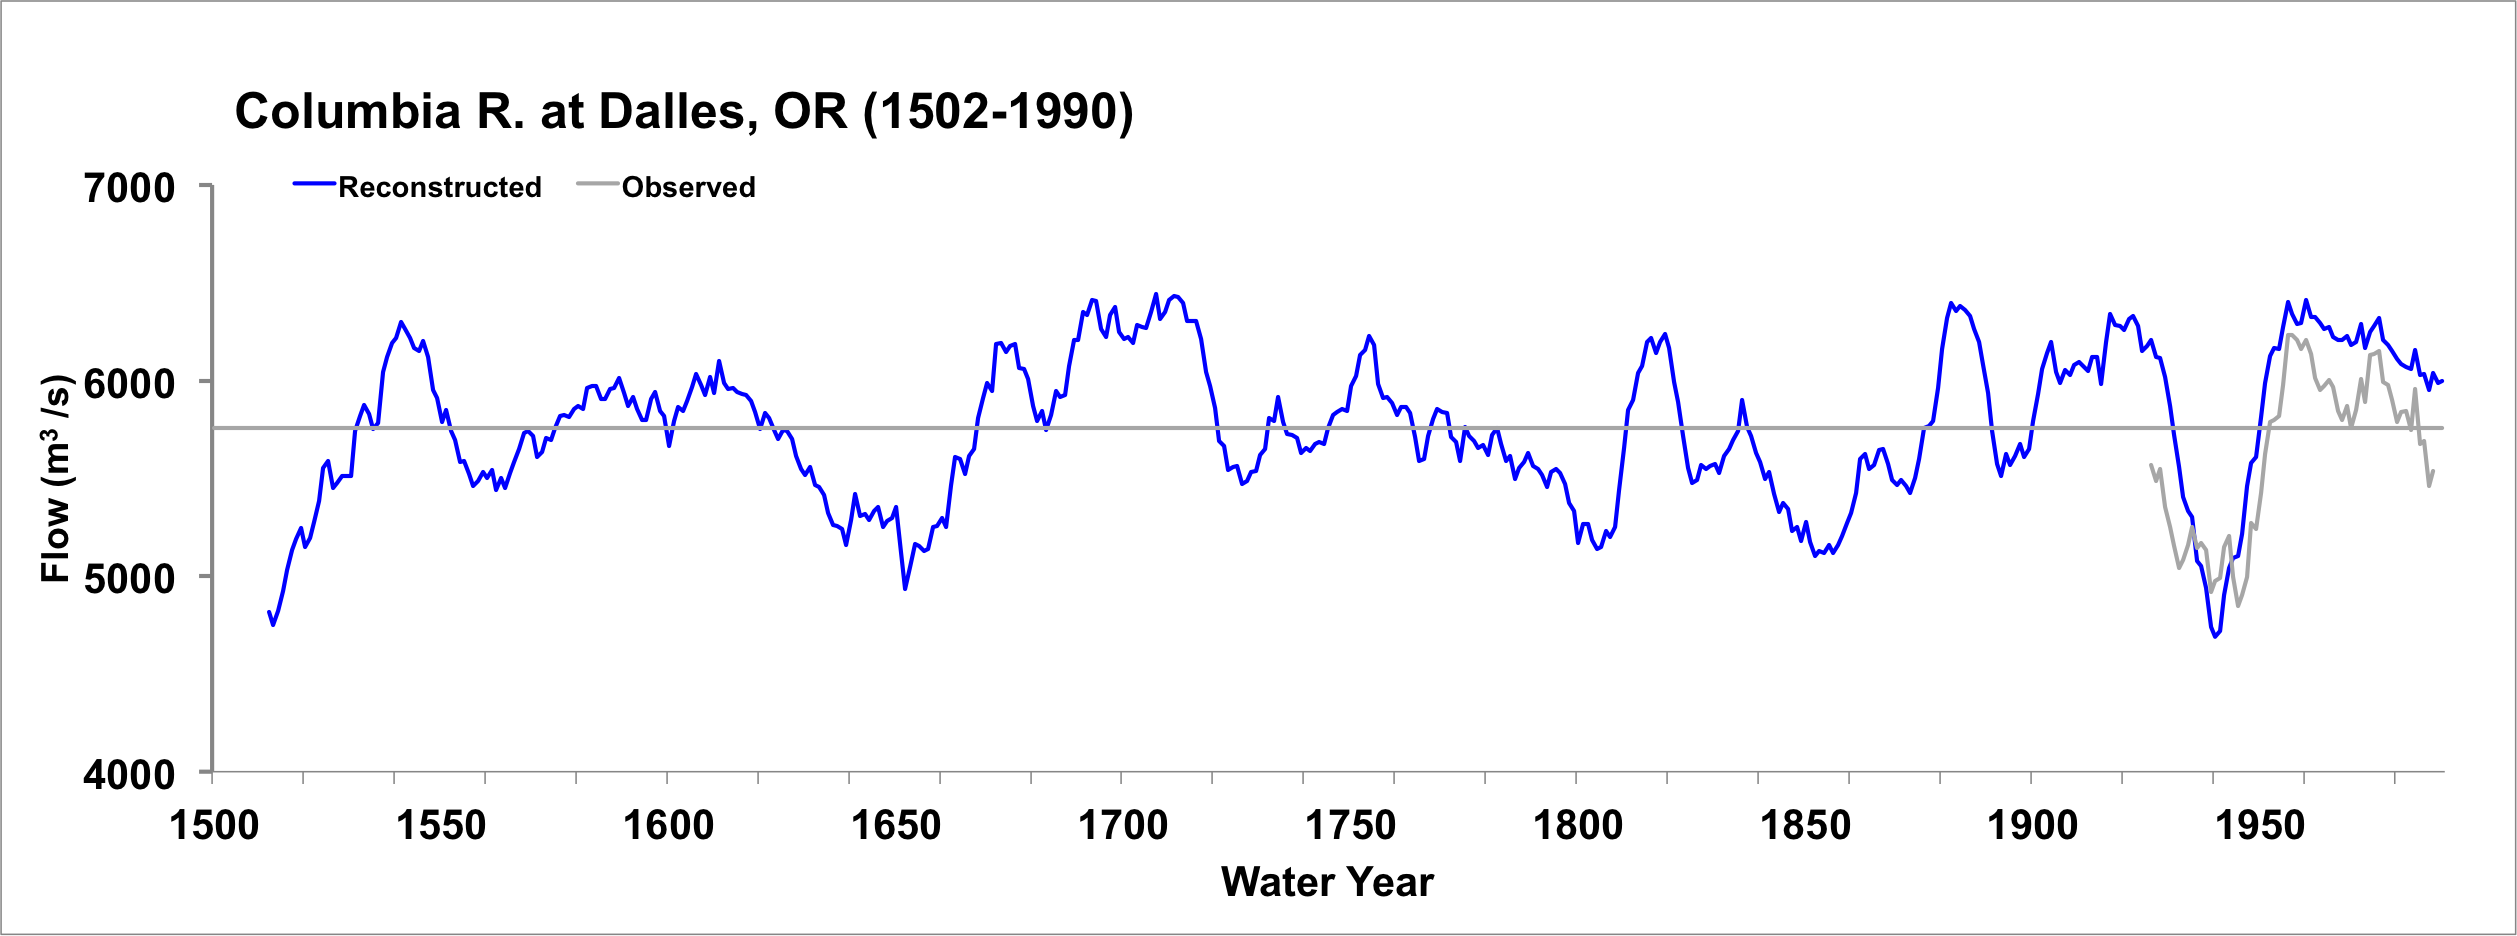
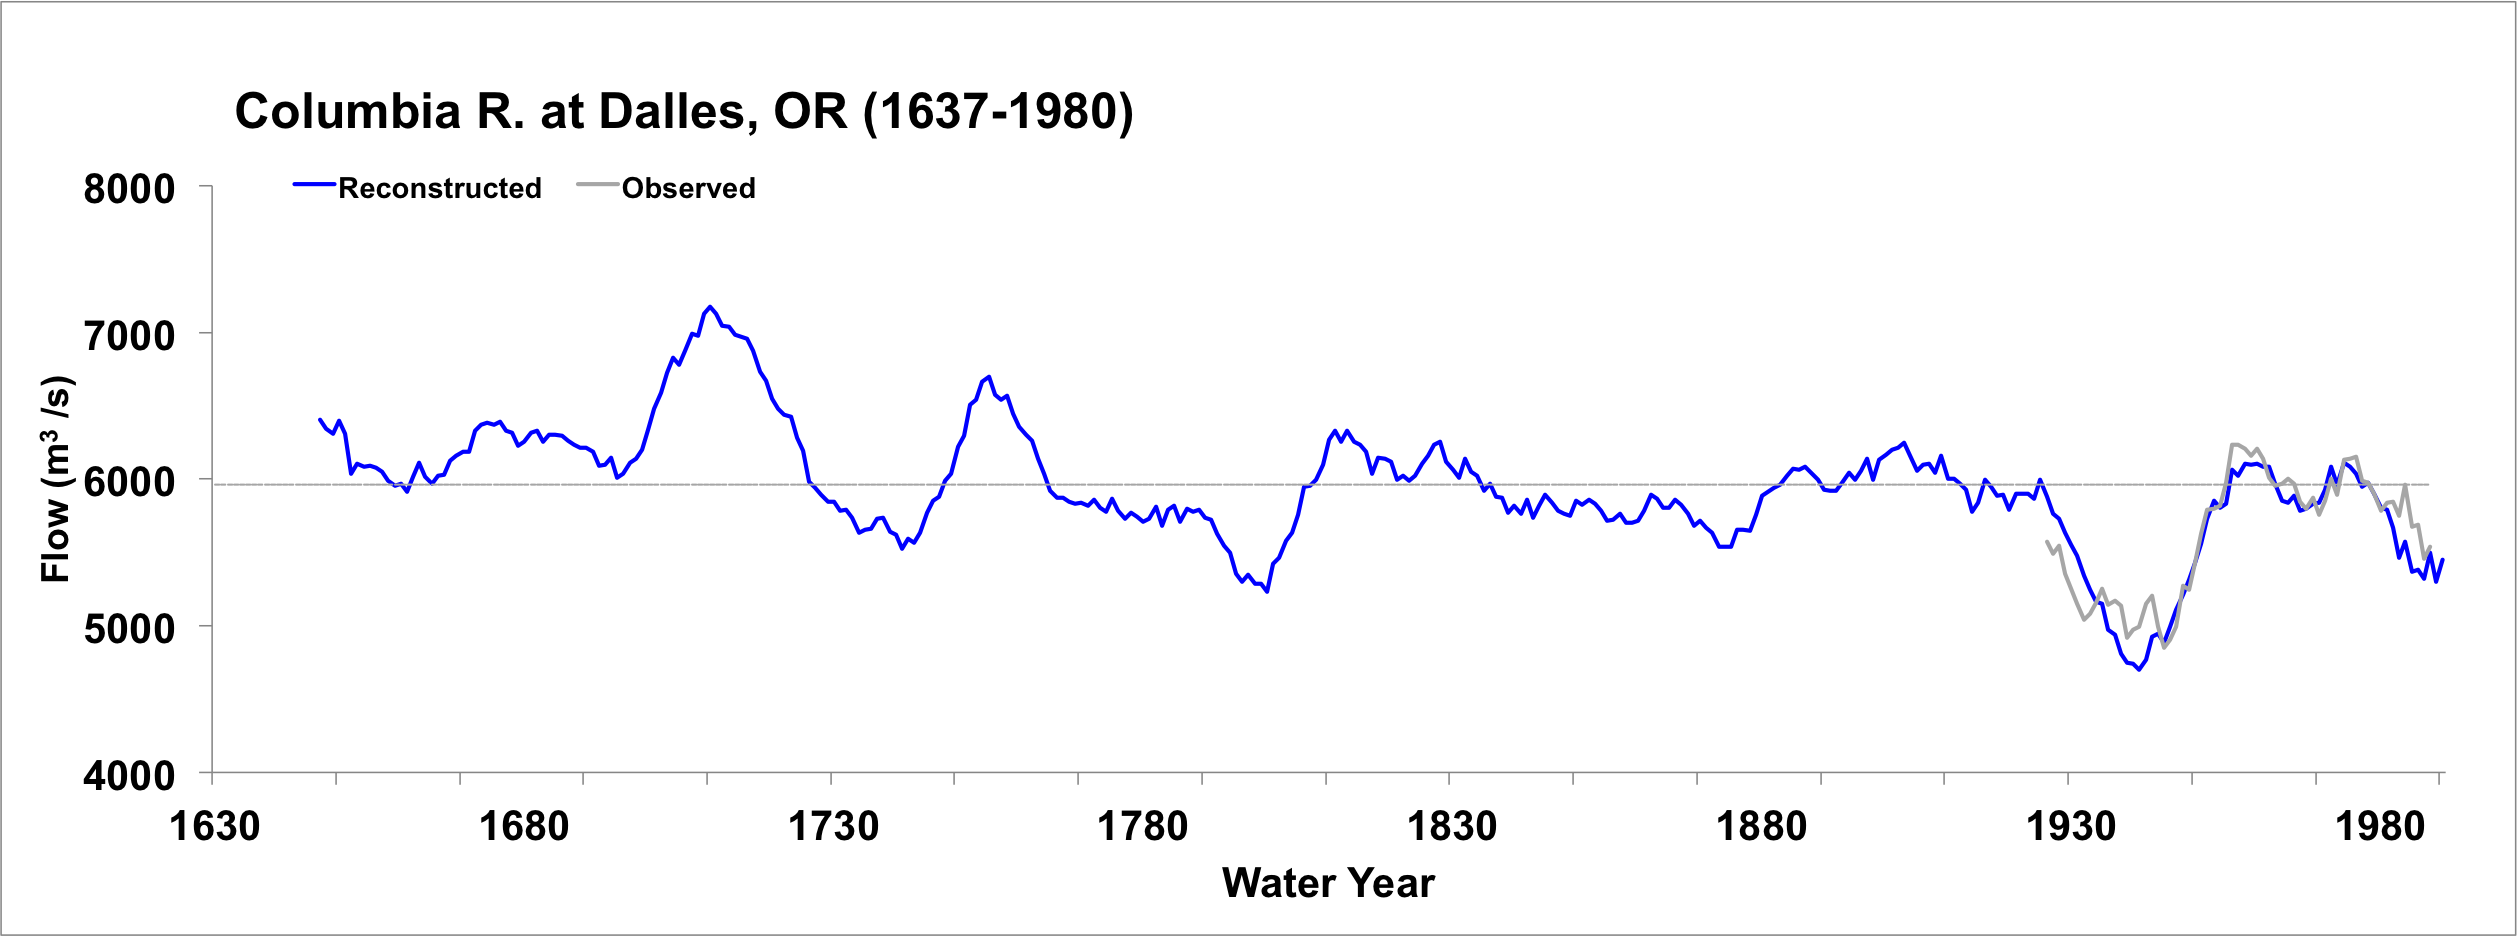
Figure 4. The 10-year running mean (plotted on final year) of reconstructed Columbia River flow, (1502-1990) and (1637-1980). Reconstructed values are shown in blue and observed values are shown in gray. The long-term reconstructed mean is shown by the dashed line.

