
Feather River inflow to Oroville Reservoir, CA
The Feather River, as a tributary of the Sacramento River, is a major input into the California State Water Project, operated by the California Department of Water Resources (CDWR). In 1999-2001, David Meko (University of Arizona Laboratory of Tree-Ring Research) developed a reconstruction of the Feather River, and a reconstruction of the Sacramento River, Four Rivers Index, for the CDWR.
References:
Meko, D. M. 2001. Reconstructed Sacramento River System Runoff From Tree Rings. Report prepared for the California Department of Water Resources, July 2001.
Methods
The Feather River reconstruction uses a time-varying subsets methodology to optimize the use of tree-ring data available for each time period. A set of 42 tree-ring chronologies from California, Nevada, and Oregon comprised the underlying dataset for the reconstruction modeling. Because the observed flow record for the Feather River is skewed towards high flows, and so the relationship between the observed flow record and the tree-ring chronologies tended to be logarithmic rather than linear, the observed record was transformed into log 10 units prior to calibration. Three different sub-period models were calibrated by regressing the log-transformed observed flows against principal components (modes of variability) derived from the tree-ring chronologies which spanned those sub-periods. Sub-period model 1 (901-1299) used PCs derived from 7 chronologies, sub-period model 2 (1300-1607) used PCs derived from 13 chronologies, and sub-period model 3 (1608-1977) used PCs derived from 26 chronologies.
| Sub-period reconstruction | Explained Variance (R2adj) | Reduction of Error (RE) | Standard Error of the Estimate | Root Mean Square Error (RMSE) |
| 1 (901-1299) | 0.61 | 0.54 | 0.137 | 0.145 |
| 2 (1300-1607) | 0.67 | 0.58 | 0.128 | 0.137 |
| 3 (1608-1977) | 0.79 | 0.70 | 0.103 | 0.116 |
Note: the calibration and validation statistics above were computed during the model development and reflect the relationship between the log-transformed observed flows and the tree-ring predictors. The scatterplot below in Figure 1 shows the relationship between the back-transformed observed flows and the reconstructed flows, which has a lower R2 than that reported in the table. Also, the Standard Error of the Estimate and Root Mean Square Error reported above are in log units, and the RMSE can't be used to compute the confidence intervals.
(For explanations of these statistics, see this document (PDF), and also the Reconstruction Case Study page.)
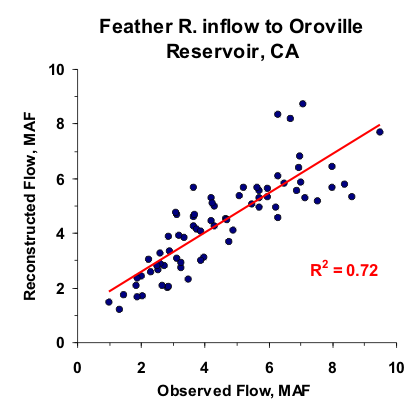
Figure 1. Scatter plot of observed and reconstructed Feather River annual flow, 1906-1977.
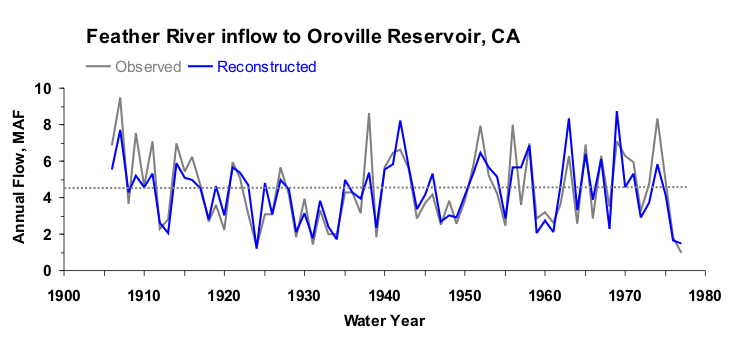
Figure 2. Observed (black) and reconstructed (blue) annual Feather River annual flow, 1906-1977. The observed mean is illustrated by the dashed line.
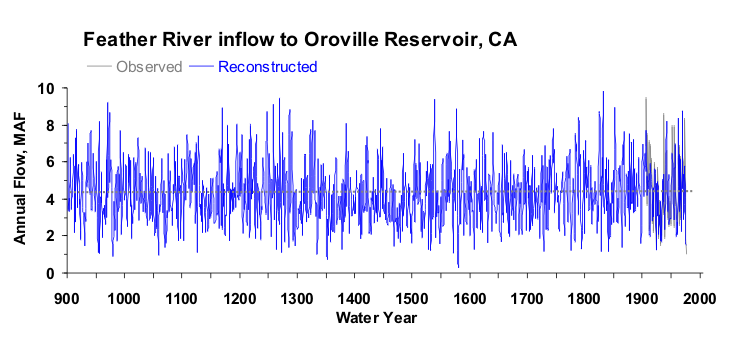
Figure 3. Reconstructed annual flow for the Feather River flow (901-1977) is shown in blue. Observed flow is shown in gray and the long-term reconstructed mean is shown by the dashed line.
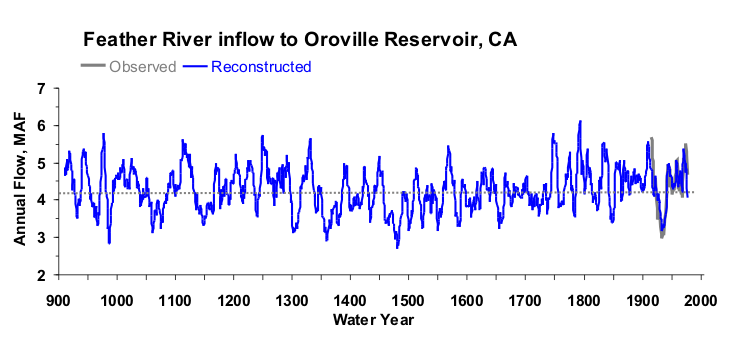
Figure 4. The 10-year running mean (plotted on final year) of reconstructed Feather River flow, 901-1977. Reconstructed values are shown in blue and observed values are shown in gray. The long-term reconstructed mean is shown by the dashed line.

