
Klamath R. at Keno, OR (natural flows)
The Klamath River flows from southern Oregon to the Pacific Ocean in northwestern California. The upper basin drains southeastern Oregon and north central California. Keno is the main gage in this part of the basin. The Klamath River is noted for its salmonid fisheries, which are an important resource for the Native American tribes in the region. The upper basin also supports vast wetlands and irrigated agriculture. The reconstruction of the Klamath River was generated as part of a project supported by the California Department of Water Resources (CDWR) and the Bureau of Reclamation WaterSmart program. In 2012, Connie Woodhouse (University of Arizona Laboratory of Tree-Ring Research) with graduate student Brewster Malevich recollected tree-ring sites originally sampled by David Meko and others, and made several new collections in the region. Reconstructions of water year streamflow were developed for the Klamath at Keno OR, and the Trinity at Lewiston CA. Water year precipitation reconstructions for Yreka and Weaverville, CA and Klamath Falls, OR were also generated as part of this CDWR project, which included updated and new flow reconstructions for the Sacramento and San Joaquin basins.
References:
Klamath/San Joaquin/Sacramento Hydroclimatic Reconstructions, Final Report to CADWR from Tree Rings
Malevich, S.B., C.A. Woodhouse, D.M. Meko. 2013. Tree-ring reconstructed hydroclimate of the Upper Klamath basin. Journal of Hydrology, doi.org/10.1016/j.jhydrol.2013.04.048
Methods
The Klamath River at Keno streamflow reconstruction was developed using stepwise regression, calibrated on the estimated natural flows developed by the Bureau of Reclamation, 1949-2000. Because there is uncertainty about the accuracy of the natural flow estimates, we consider this to be a preliminary reconstruction. The pool of predictor candidate chronologies for these reconstructions included a total of 20 chronologies developed for this study or from the International Tree-Ring Databank (ITRDB). Selection criteria for the pool included a start date of 1650 or before, ended in 1996 or later, and significant correlation with the gage record (p < 0.5). Leave-one-out cross-validation was used to validate these reconstructions.
| Statistic | Calibration | Validation |
| Explained variance (R2) | 0.76 | |
| Reduction of Error (RE) | 0.65 | |
| Standard Error of the Estimate | ||
| Root Mean Square Error (RMSE) | 288 KAF |
(For explanations of these statistics, see this document (PDF), and also the Reconstruction Case Study page.)
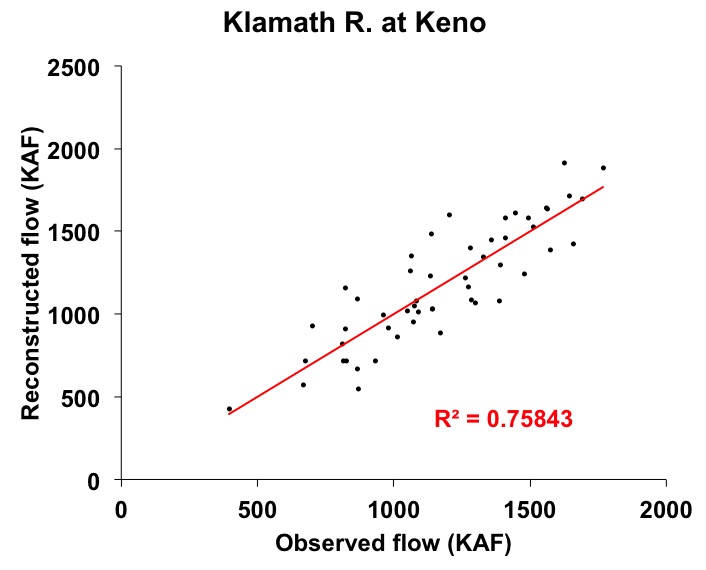
Figure 1. Scatter plot of observed and reconstructed Klamath River annual flow, 1949-2000.
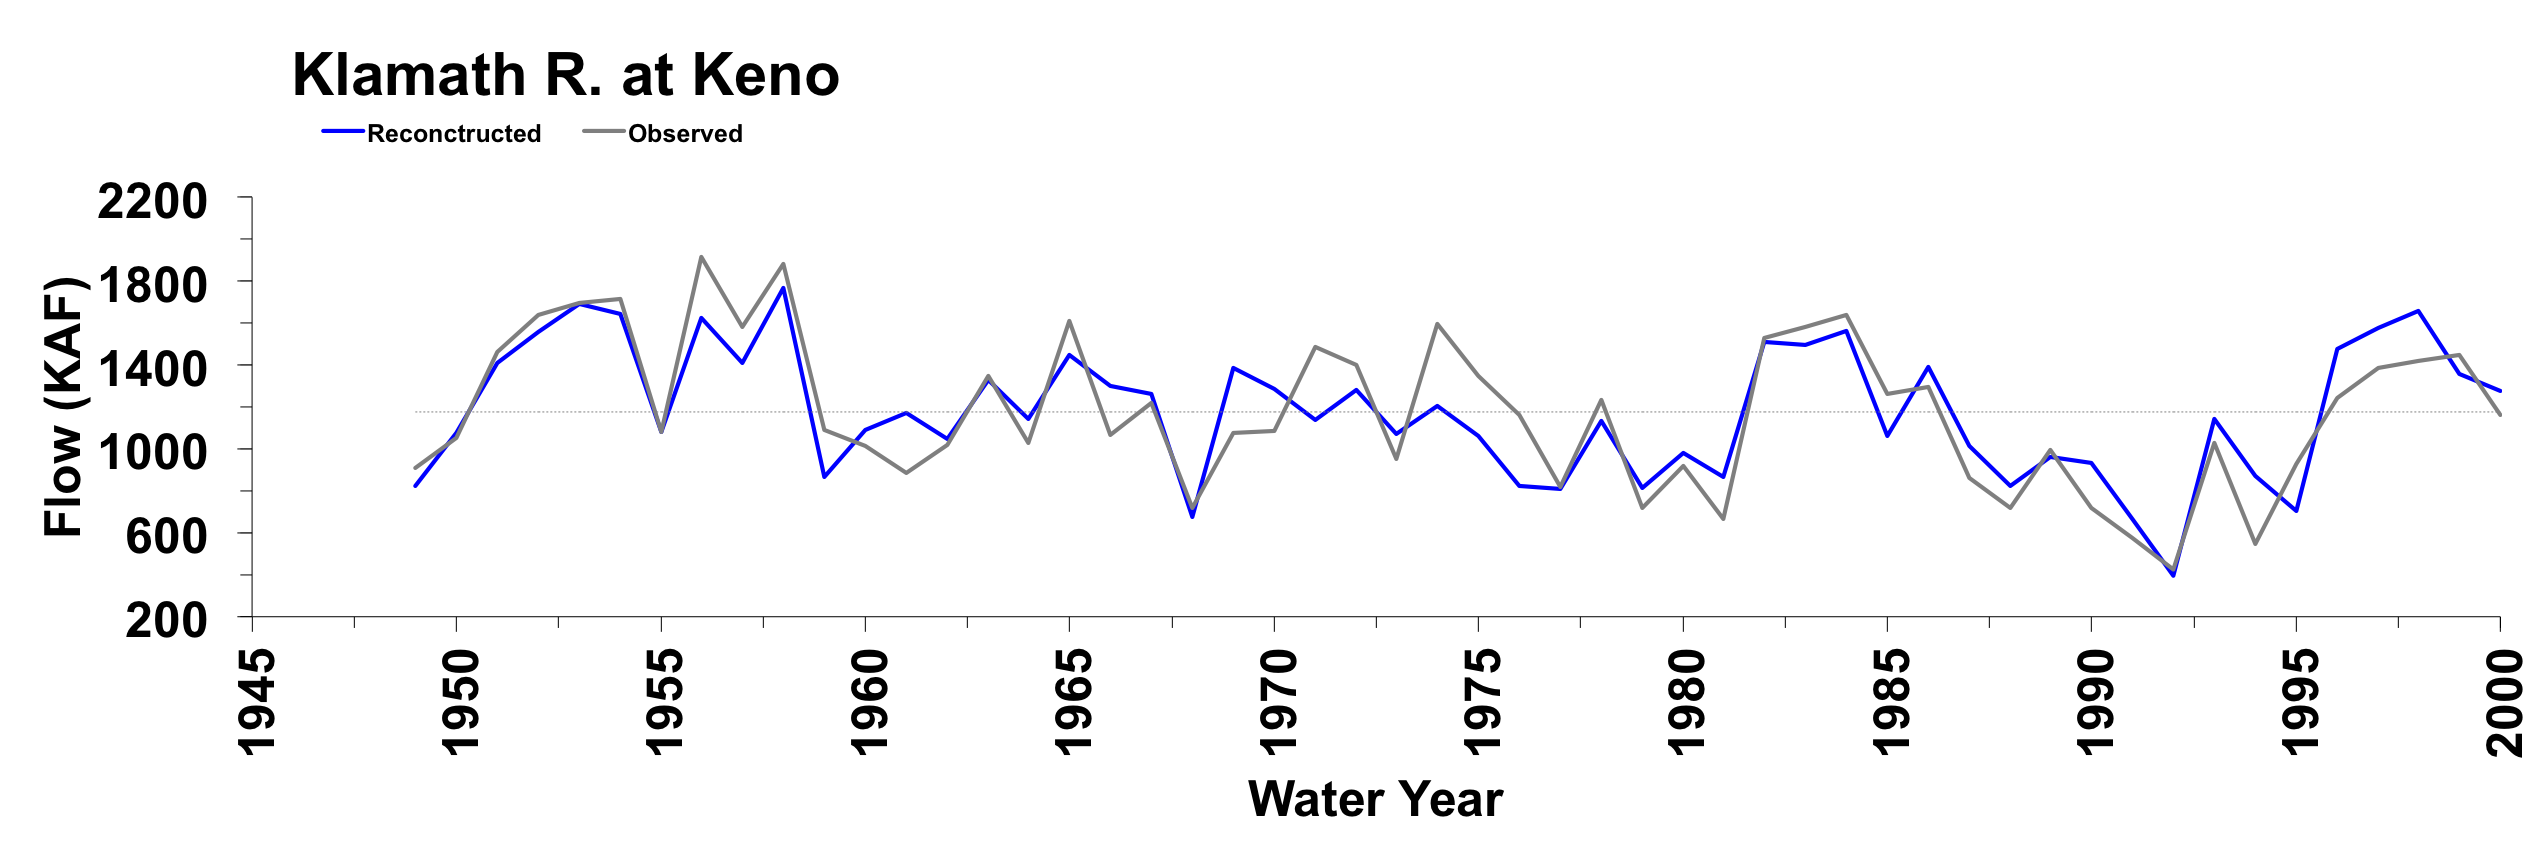
Figure 2. Observed (black) and reconstructed (blue) annual Klamath River annual flow, 1949-2000. The observed mean is illustrated by the dashed line.
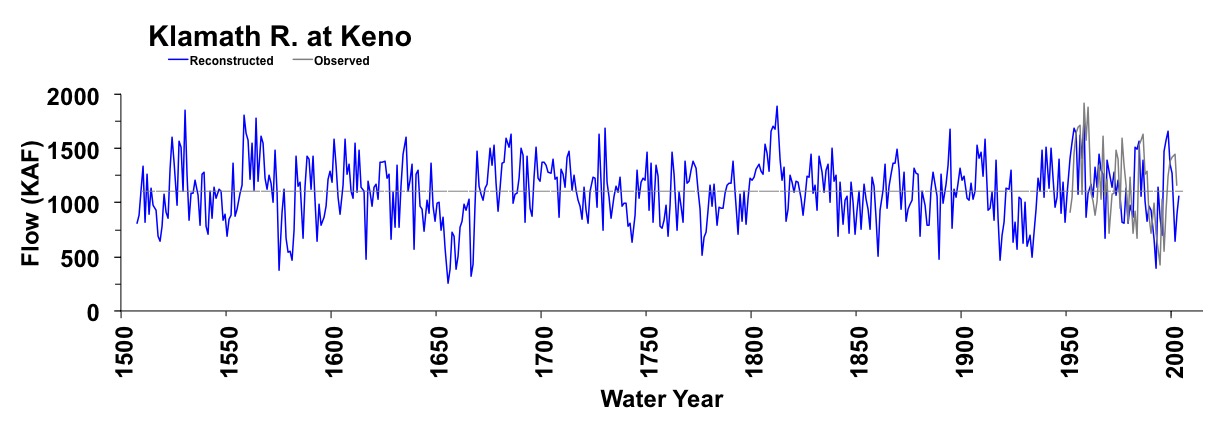
Figure 3. Reconstructed annual flow for the Klamath River (1507-2003) is shown in blue. Observed flow is shown in gray and the long-term reconstructed mean is shown by the dashed line.
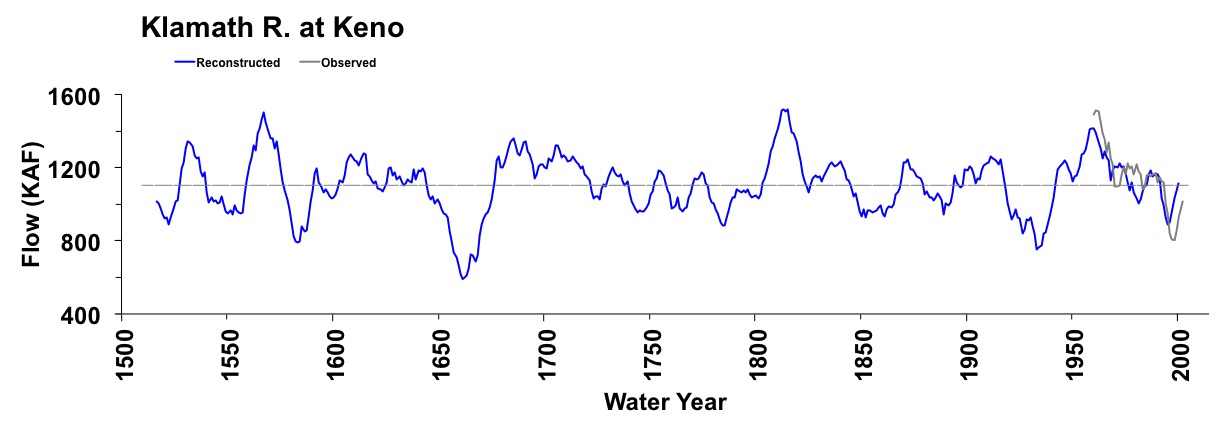
Figure 4. The 10-year running mean (plotted on final year) of reconstructed Klamath River flow, 1507-2003. Reconstructed values are shown in blue and observed values are shown in gray. The long-term reconstructed mean is shown by the dashed line.

