
Lake Arrowhead
The Lake Arrowhead precipitation gage (NOAA co-op station 044671) is located on the northern side of the San Bernadino Mountains at 5230 ft. Precipitation at Lake Arrowhead reflects the northern and more arid side of the Transverse ranges, which contribute runoff to the Mojave River basin. The gage record extends from 1942 to 2010, with some missing data (mostly individual months). To estimate missing values and extend this record to 2015, neighboring co-op stations, Squirrel Inn 2 California (048479) and Big Bear Lake, California (040741) were used. Squirrel Inn 2 was used to fill in missing months, and Big Bear was used to extend the record from 2011 to 2015. The ratio between the total monthly precipitation averaged over a common period of years, along with the precipitation value for the missing year/month at Squirrel Inn 2 or Big Bear was used to estimate the value for that year/month at Lake Arrowhead. No record contained a value for Aug 1980, so the average August precipitation value from Lake Arrowhead was used.
The reconstruction of water year precipitation at Lake Arrowhead was generated as part of a project supported by the California Department of Water Resources (CADWR). This project includes reconstructions of water year precipitation (San Gabriel Dam, Lake Arrowhead, Ojai, and Cuyamaca) and streamflow (Arroyo Seco and Santa Ana River) for southern California and the Kern River in the southern Sierras. This set of reconstructions was developed by Dave Meko, Erica Bigio, and Connie Woodhouse in 2017, based on updated and new collections of tree-ring data in California sampled for this project.
Methods
Total water year (October-September) precipitation at Lake Arrowhead was reconstructed using a two-stage regression procedure. Tree-growth at each site was first converted into an estimate of precipitation by stepwise regression of precipitation using tree-ring width indices, from the current year and lagged one year, as predictors. Squared terms on the tree-ring predictors were also included in the regression to allow for possible curvature in relationships between tree-growth and precipitation. In the second step, the gage reconstruction was generated by averaging an appropriate set of single site reconstructions. Final estimates of precipitation were interpolated from a piecewise-linear smoothed scatter plot of the observed precipitation values and the precipitation estimates averaged over the individual tree-ring sites. The procedure was repeated for subsets of tree-ring chronologies with different periods of common time coverage to build a “most-skillful” reconstruction, starting in the early 1400s, and a “longest” reconstruction, starting in the early 1100s. Details of the reconstruction method can be found here.
| Statistic | Most Skillful: Calibration | Most Skillful: Validation | Longest Model: Calibration | Longest Model: Validation |
| Explained variance (R2) | 0.73 | 0.60 | ||
| Reduction of Error (RE) | 0.71 | 0.57 | ||
| Standard Error of the Estimate | 10.114 in. | 12.453 in. | ||
| Root Mean Square Error (RMSE) | 10.914 in. | 13.240 in. |
Note: The statistics listed in the table represent average accuracy, while the reconstruction method yields error bars that vary in width over time -- generally wider for wet years than for dry years. The listed statistic R2, the decimal proportion of variance explained by the reconstruction in the calibration period, is computed directly from the reconstruction residuals. For an explanation of these statistics, see this document.
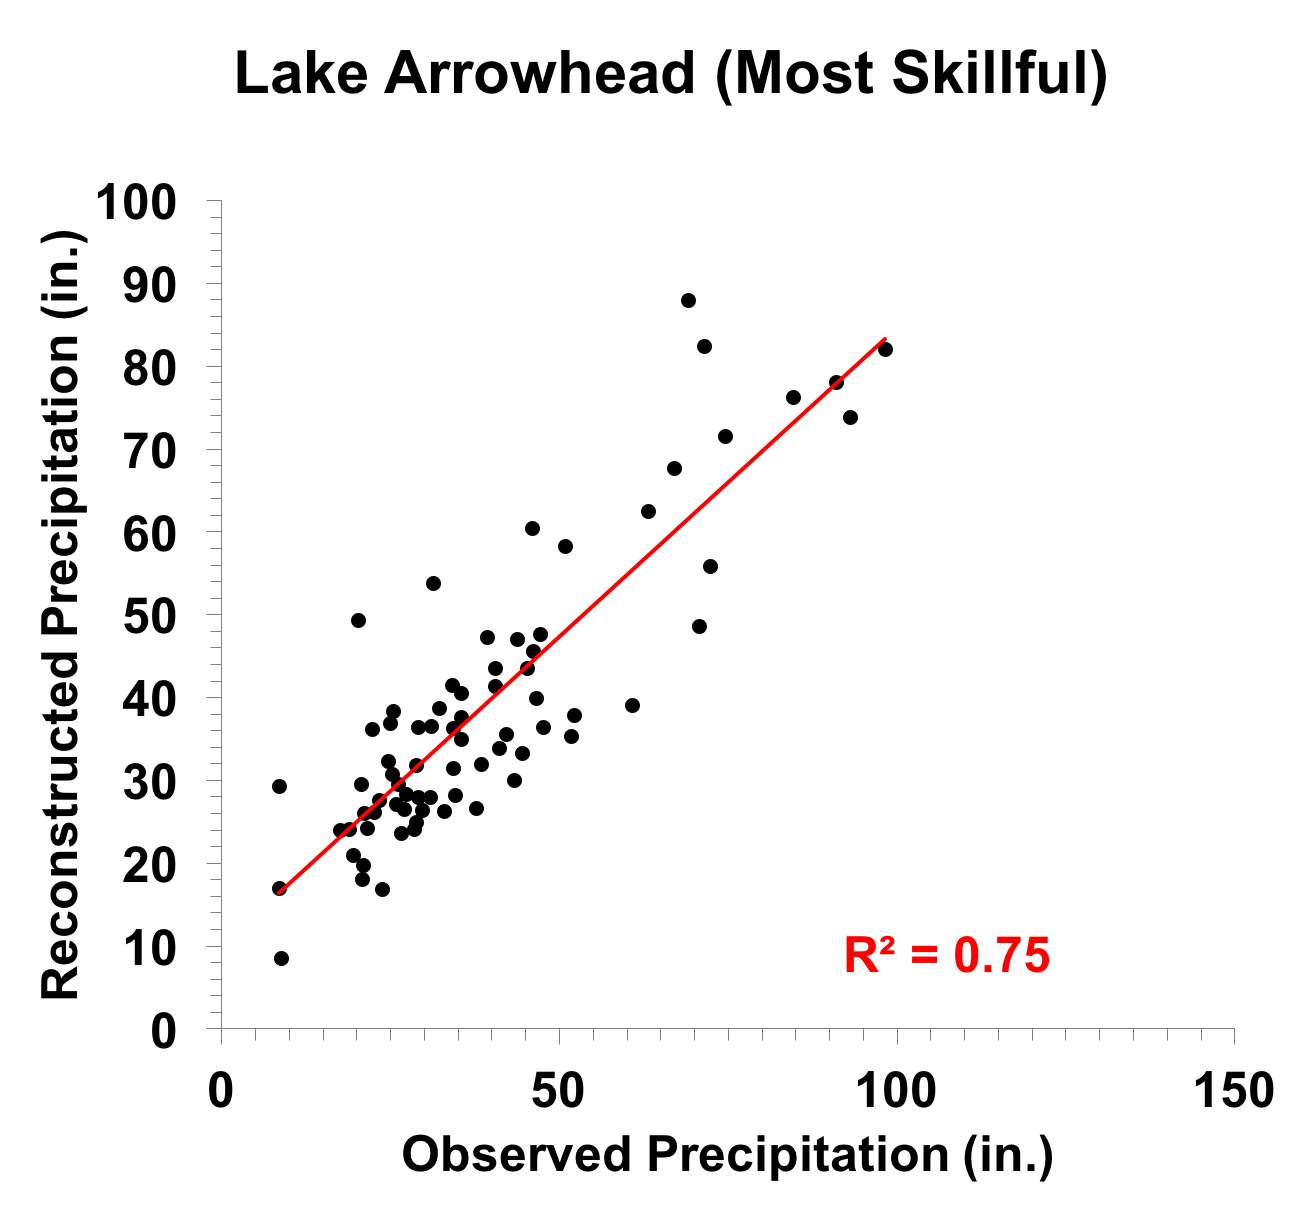
Figure 1. Scatter plot of observed and reconstructed Lake Arrowhead annual precipitation, 1942-2015. Note that the R2 value here is slightly different than in the table. The table R2 value is the average explained variance from the three models that make up the most skillful reconstruction. The value in the scatter plot reflects the explained variance for the two models that cover the instrumental period (more details).
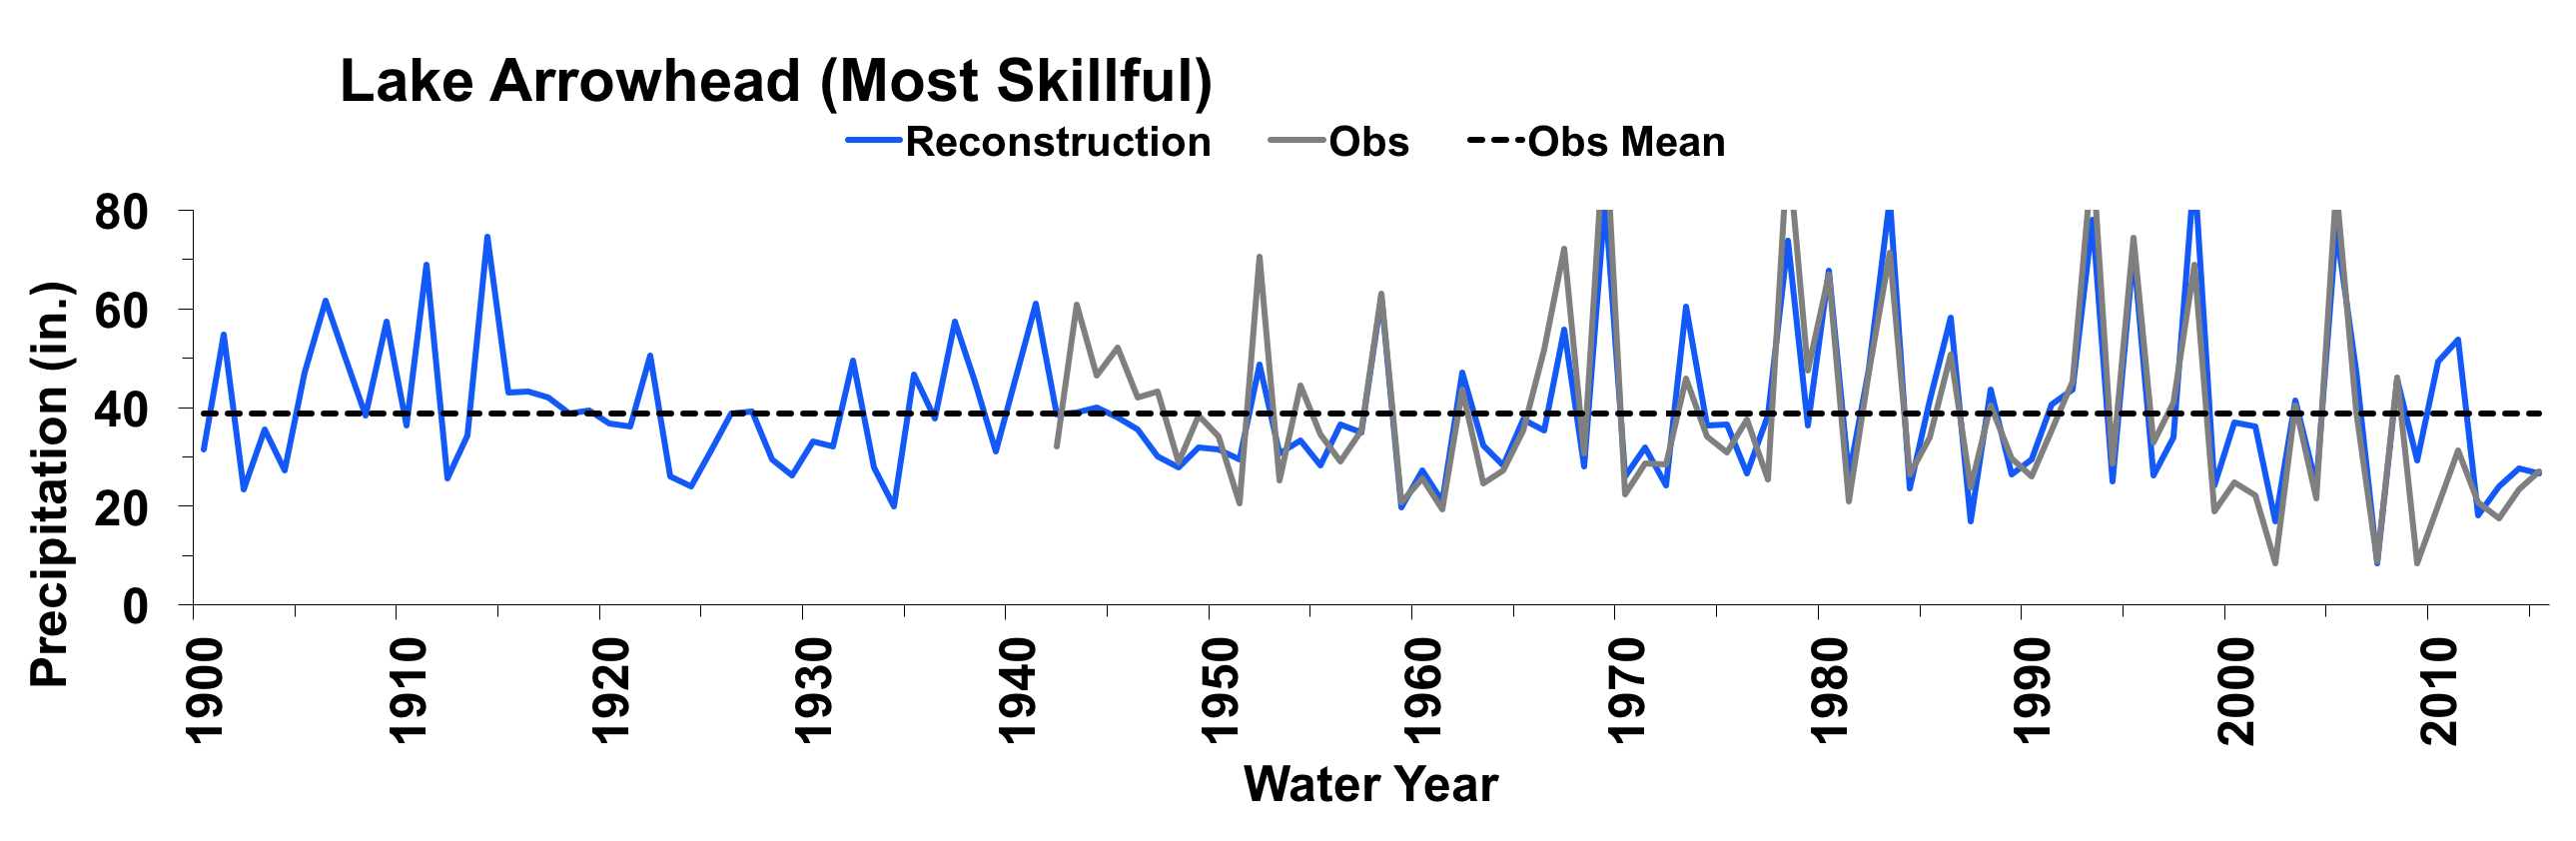
Figure 2. Observed (gray) 1942-2015, and reconstructed (blue) 1900-2016, Lake Arrowhead annual precipitation. The observed mean is illustrated by the black dashed line.
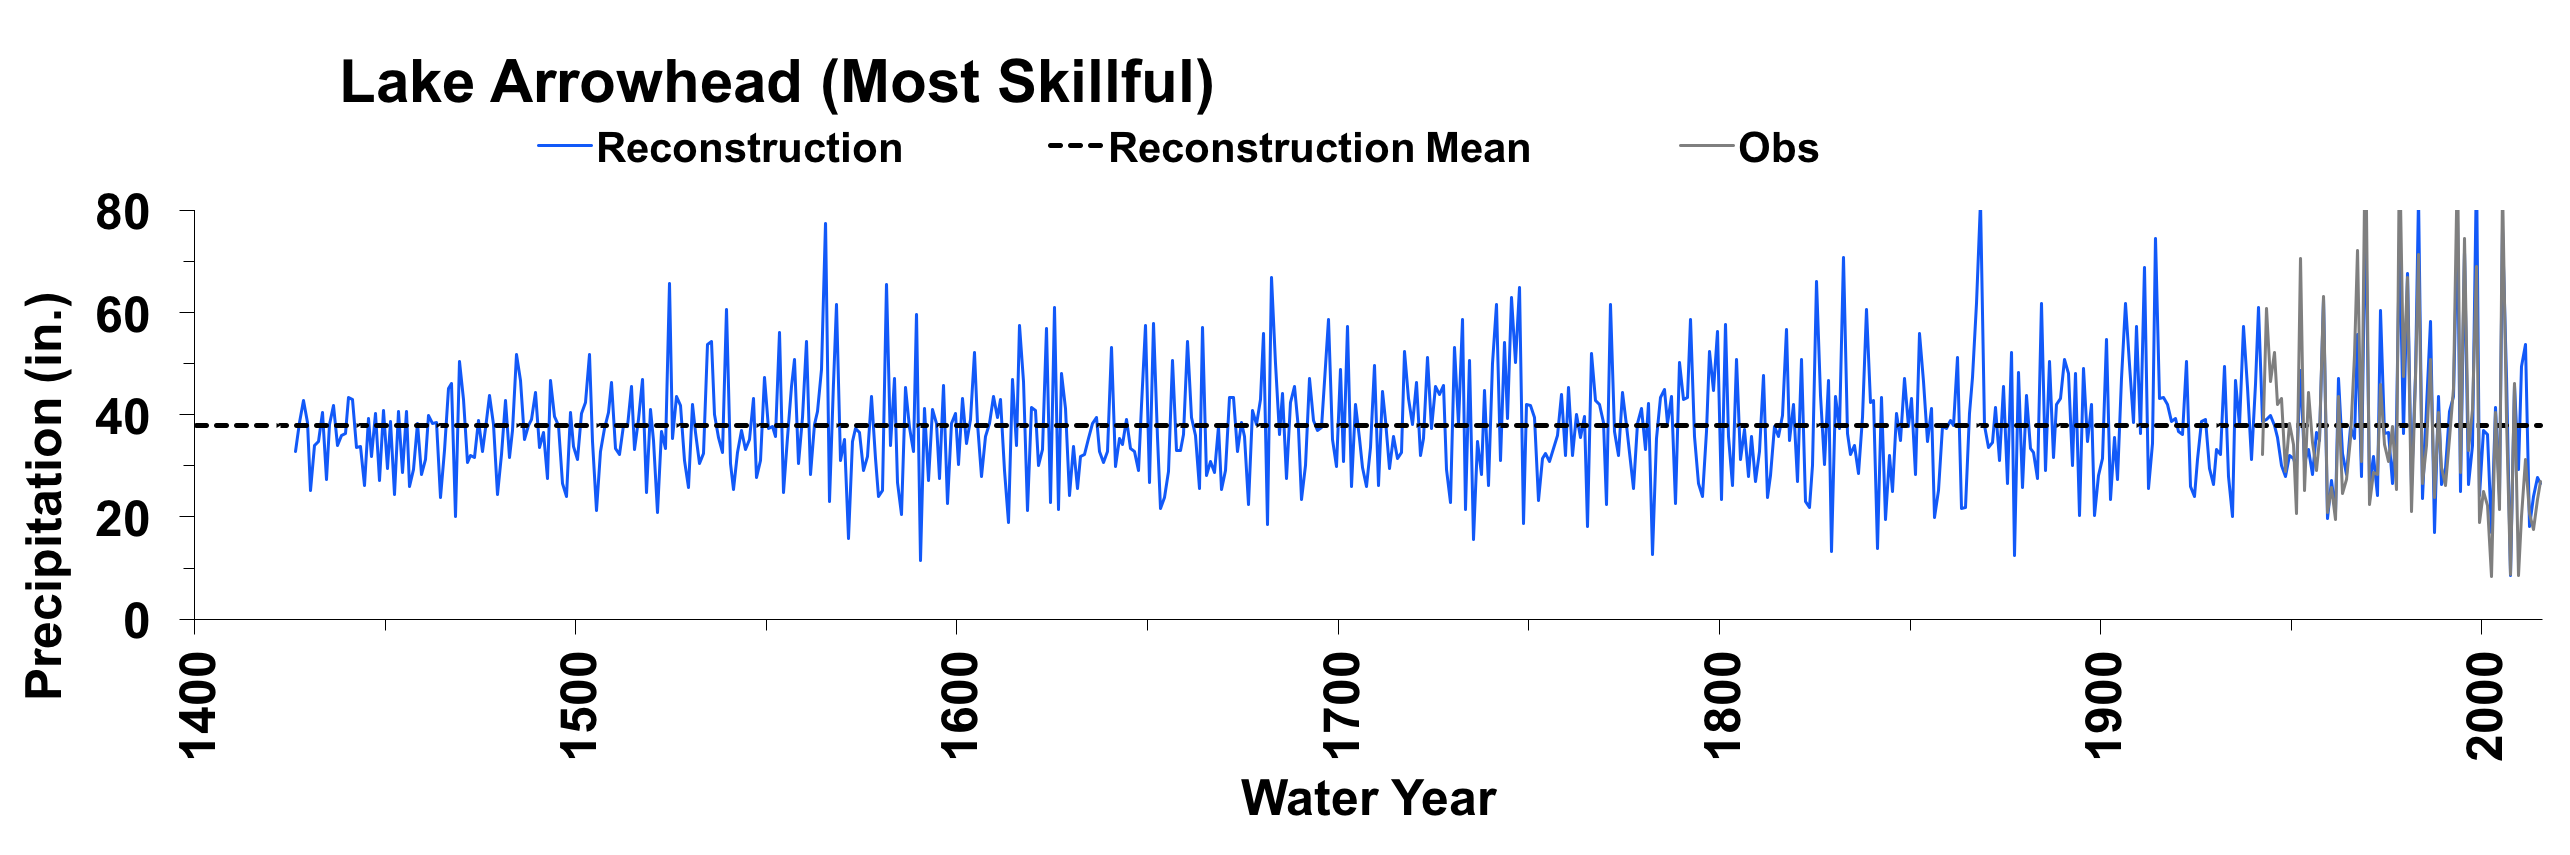
Figure 3. Reconstructed annual precipitation for Lake Arrowhead (1426-2016) is shown in blue. Observed flow is shown in gray and the long-term reconstructed mean is shown by the black dashed line.
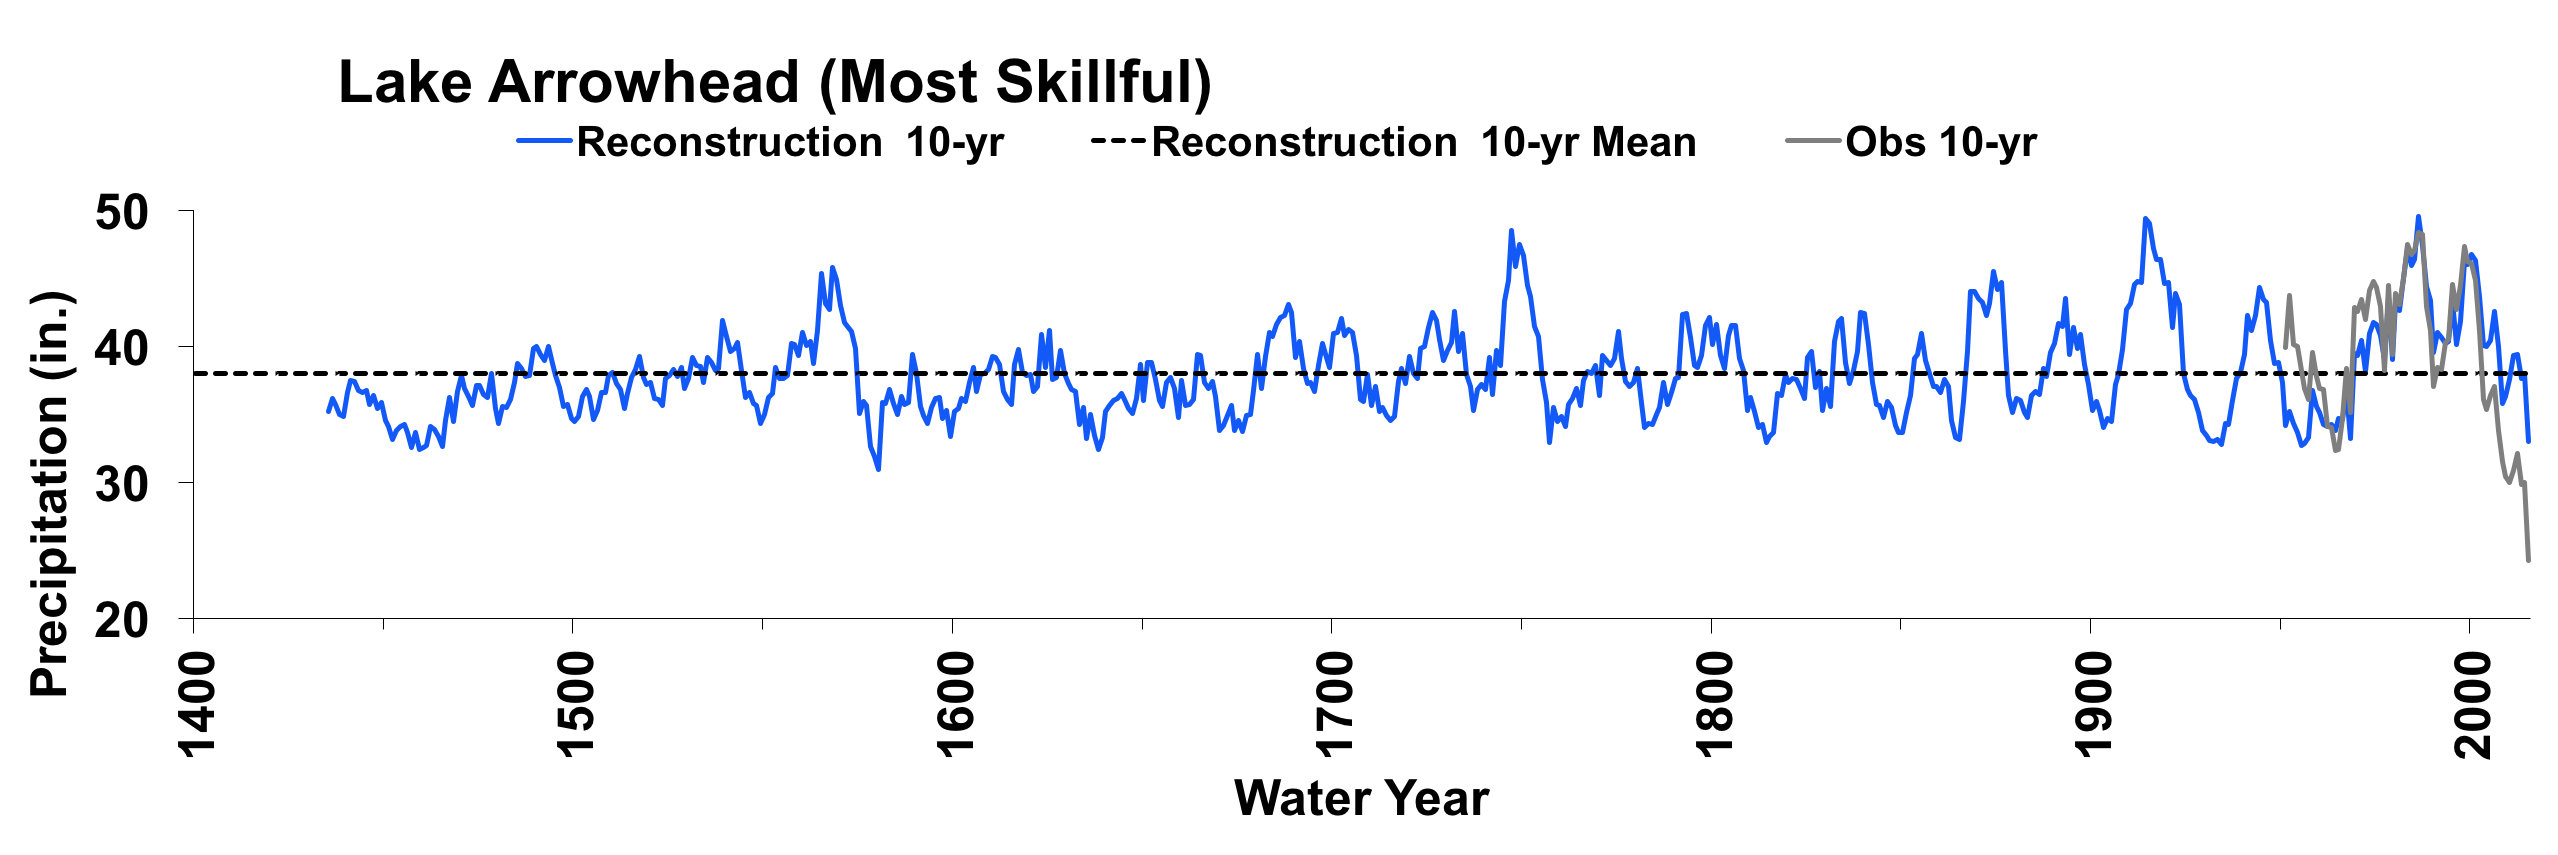
Figure 4. The 10-year running mean (plotted on final year) of reconstructed annual precipitation for Lake Arrowhead, 1426-2016. Reconstructed values are shown in blue and observed values are shown in gray. The long-term reconstructed mean is shown by the black dashed line.
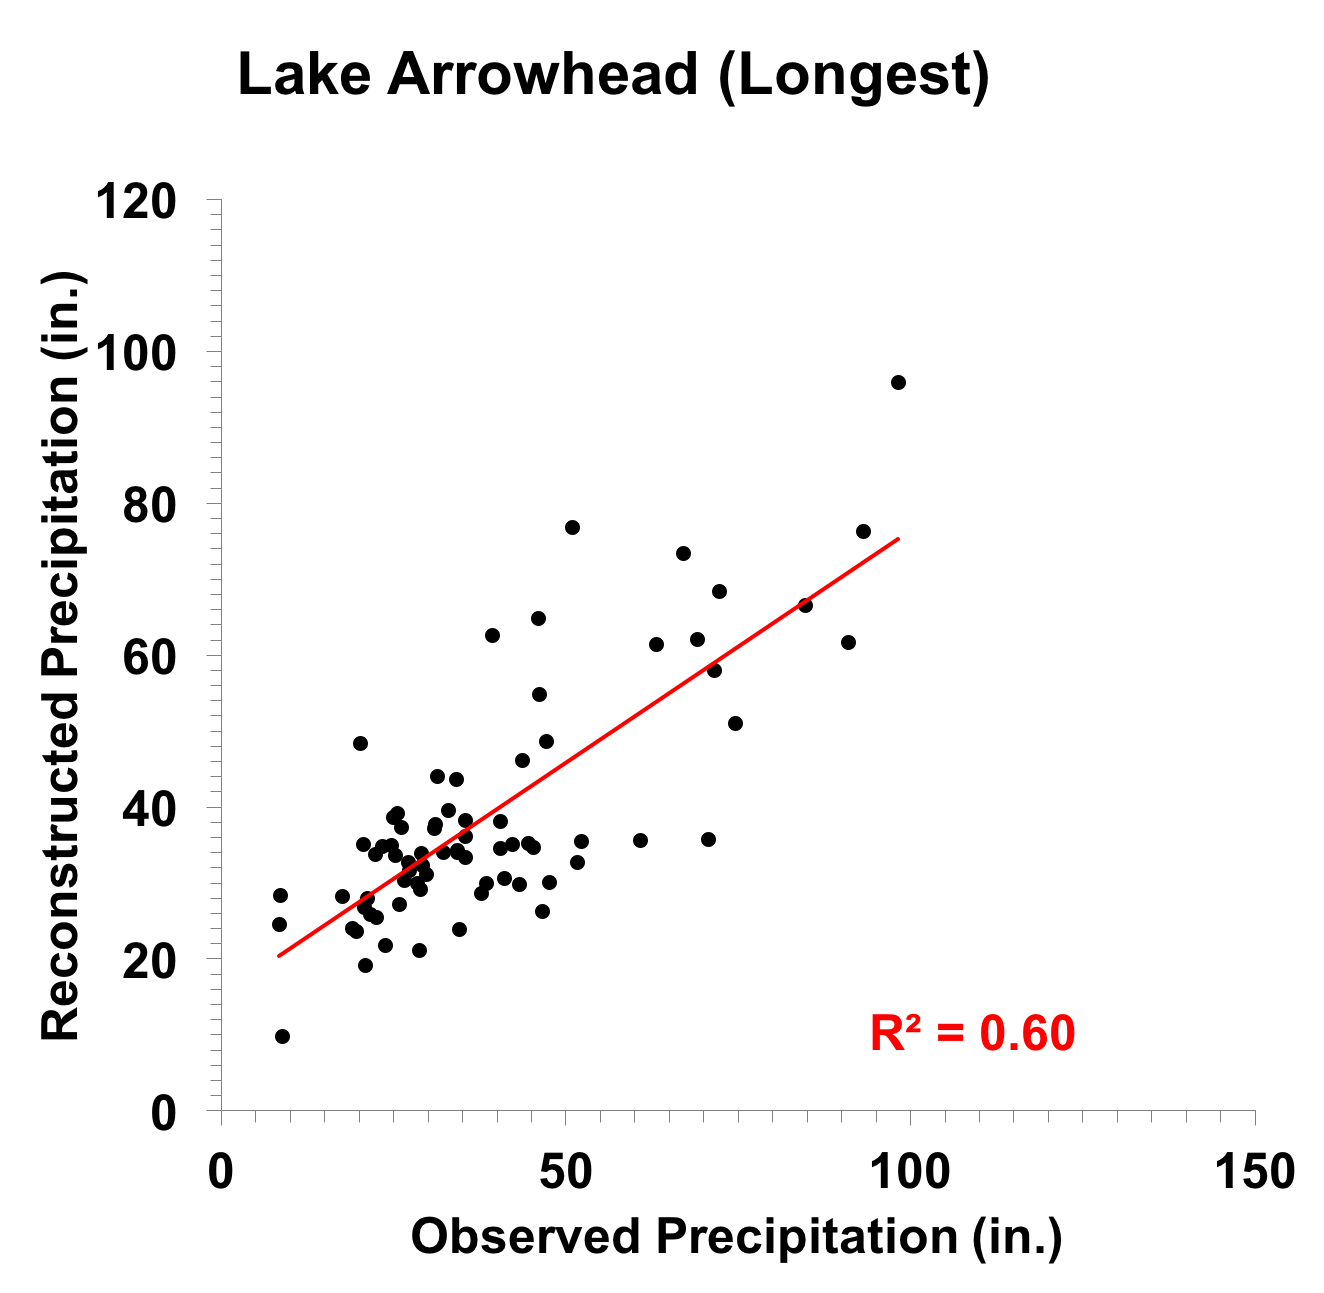
Figure 5. Scatter plot of observed and reconstructed Lake Arrowhead annual precipitation,1942-2015 (more details).
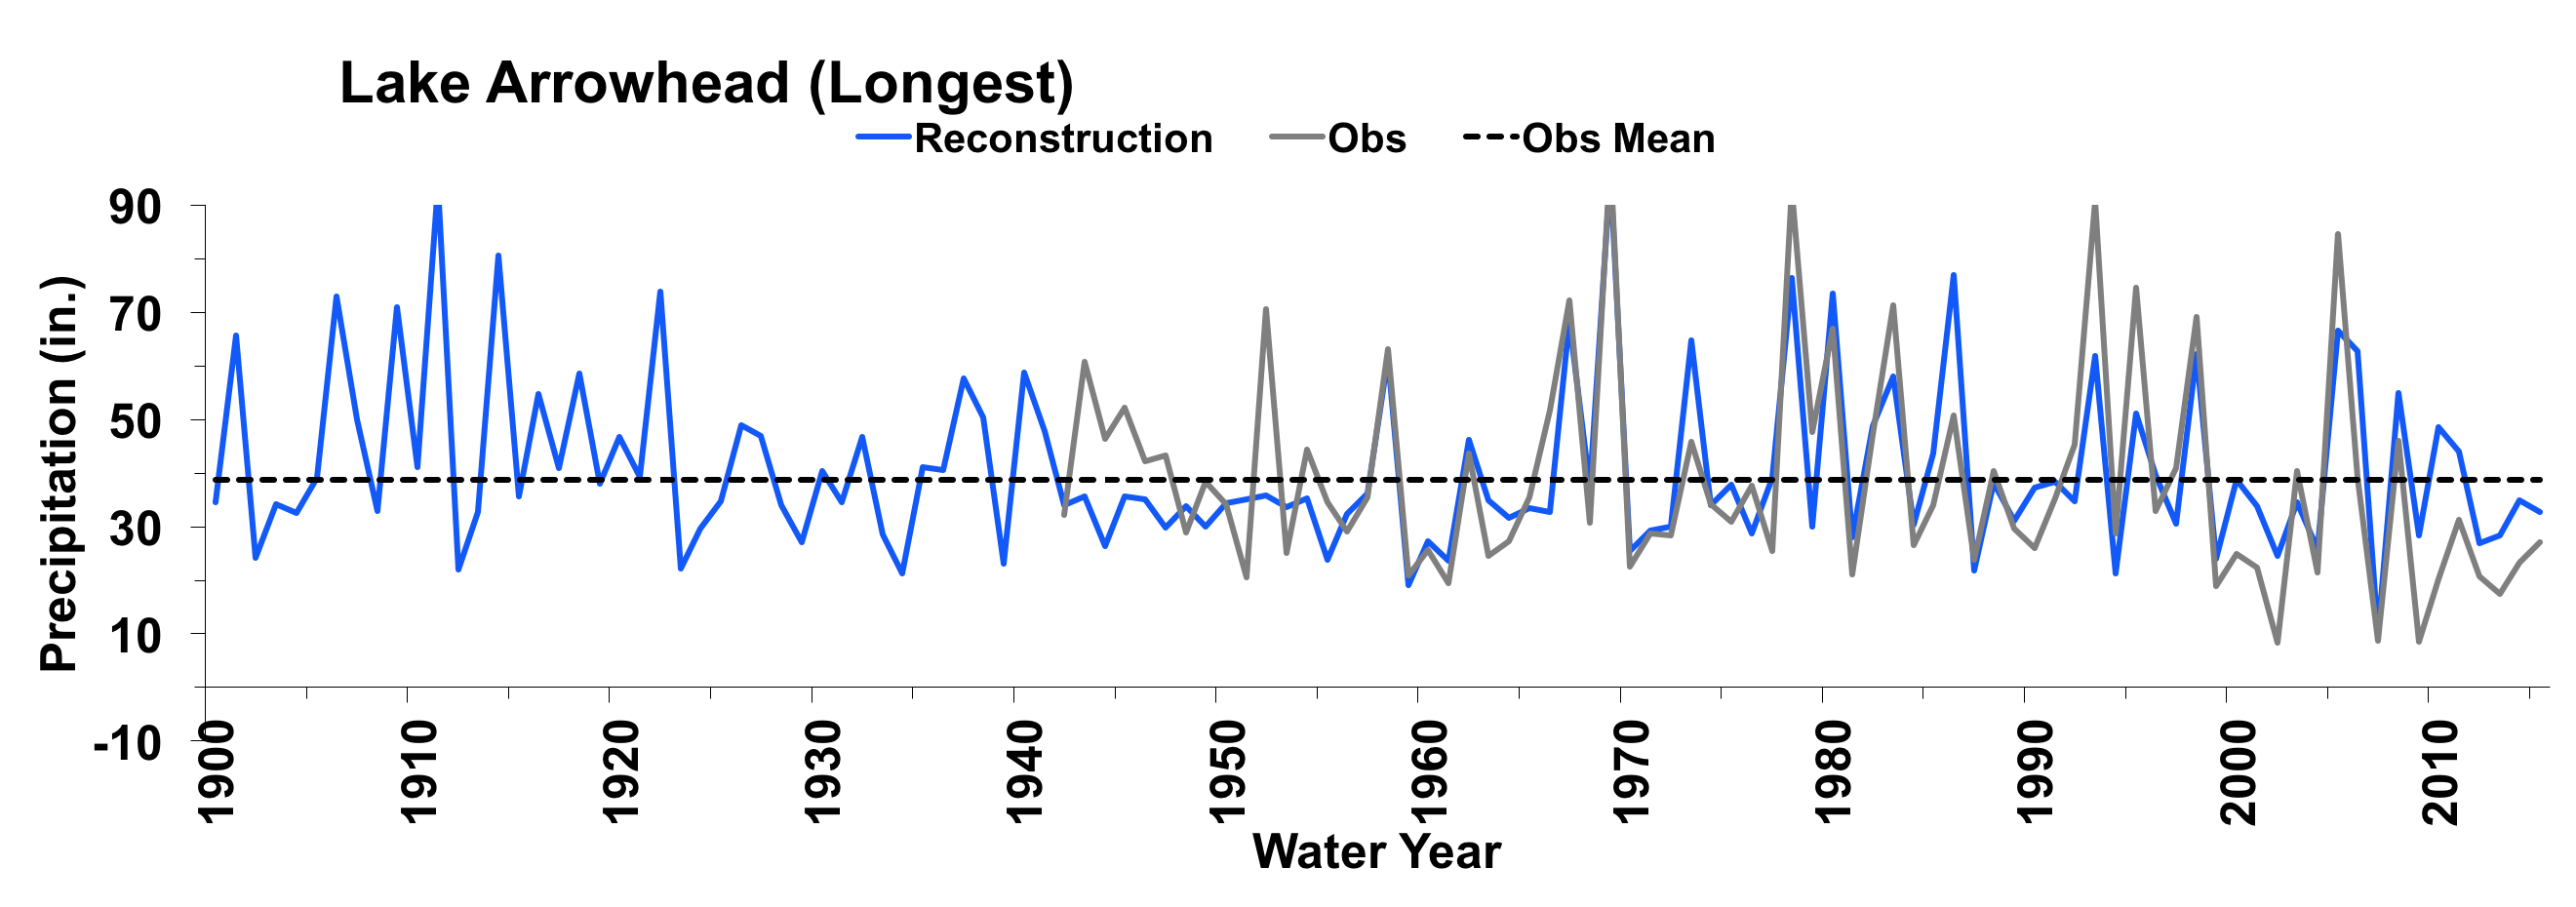
Figure 6. Observed (black) 1942-2015, and reconstructed (blue) 1900-2016, Lake Arrowhead annual precipitation. The observed mean is illustrated by the black dashed line.
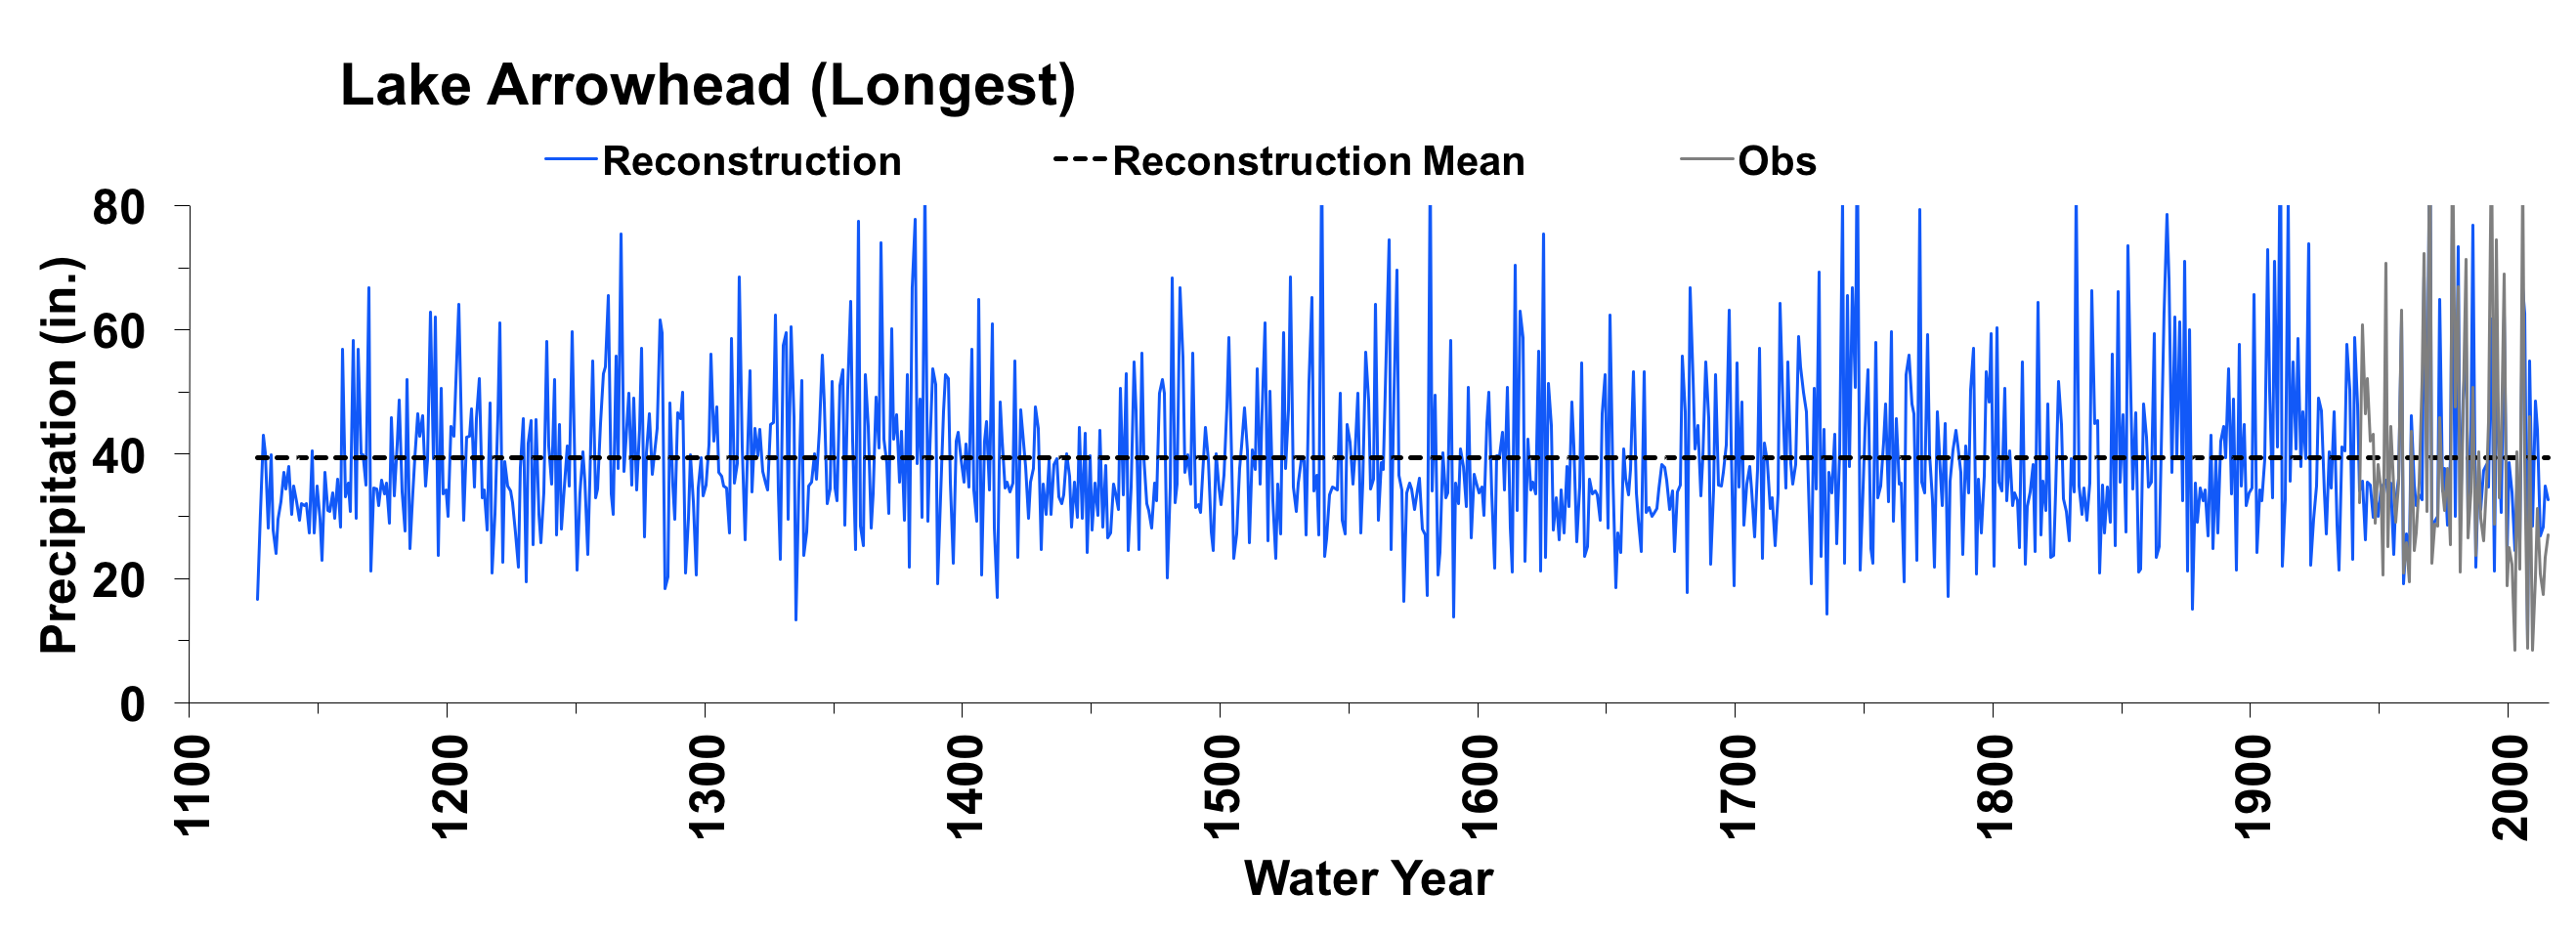
Figure 7. Reconstructed annual precipitation for Lake Arrowhead (1126-2015) is shown in blue. Observed flow is shown in gray and the long-term reconstructed mean is shown by black dashed line.
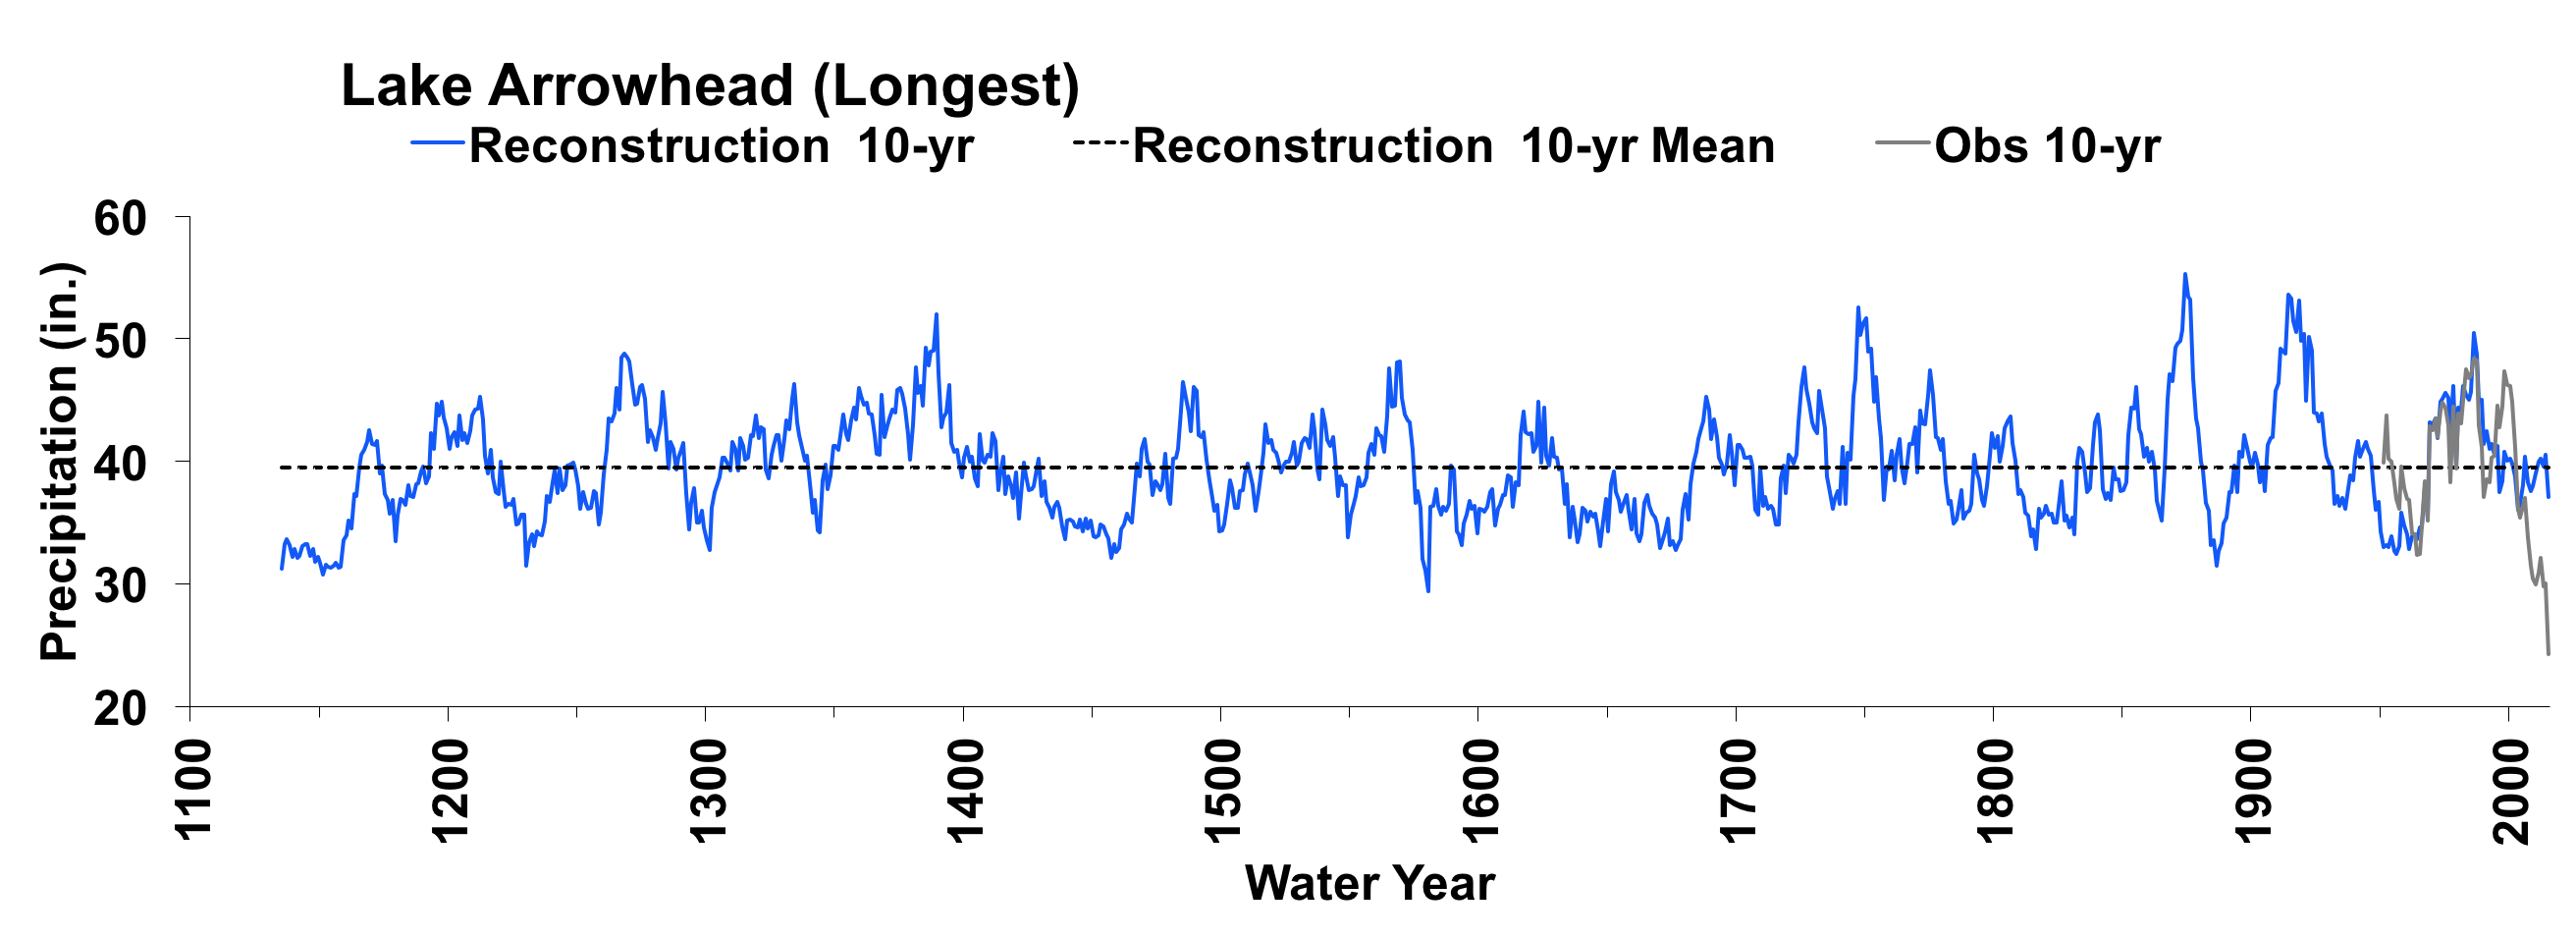
Figure 8. The 10-year running mean (plotted on final year) of reconstructed annual precipitation at Lake Arrowhead, 1126-2015. Reconstructed values are shown in blue and observed values are shown in gray. The long-term reconstructed mean is shown by the black dashed line.

