
Little Popo Agie River near Lander, WY
The Wind River (which then becomes the Bighorn River) supplies water for 80,000 people and 600,000 acres of irrigated agriculture in north-central Wyoming. Much of the Wind River Basin lies within the Wind River Indian Reservation, home of the Northern Arapaho and Eastern Shoshone.
In 2005-2007, Tom Watson, Anthony Barnett, Glenn Tootle, Steve Gray, and colleagues at the University of Wyoming conducted a research effort to collect new chronologies in the Wind River basin and generate streamflow reconstructions for several gages. Their work resulted in three reconstructions of annual (water-year) streamflow, two of which are archived in TreeFlow: the Wind River near Dubois, WY, and the Little Popo Agie River near Lander, WY.
Note: The reconstruction shown below is different than the models described in Barnett et al. (2009).
References:
Watson, T. A., F. A. Barnett, S. T. Gray, and G. A. Tootle. 2009. Reconstructed Streamflows for the Headwaters of the Wind River, Wyoming, United States. Journal of the American Water Resources Association 45(1):224-236.
Methods
A forward stepwise linear regression procedure was used to calibrate the observed flow record with a pool of potential predictors consisting of tree-ring chronologies from Wyoming, Colorado, Montana, and Utah that were pre-screened for significant (at >99%) relationships with the observed record. The residual chronologies, with the low-order autocorrelation removed, were used. Three predictor chronologies were selected by the stepwise procedure for the reconstruction model. Validation statistics were computed using a leave-one-out (cross-validation) approach.
Predictors: Dutch John Mtn. (UT), North Park Update (NPU), Clarks Fork of the Yellowstone (WY)
| Statistic | Calibration | Validation |
| Explained variance (R2) | 0.58 | |
| Reduction of Error (RE) | 0.50 | |
| Standard Error of the Estimate | 13,247 AF | |
| Root Mean Square Error (RMSE) | 14,179 AF |
(For explanations of these statistics, see this document (PDF), and also the Reconstruction Case Study page.)
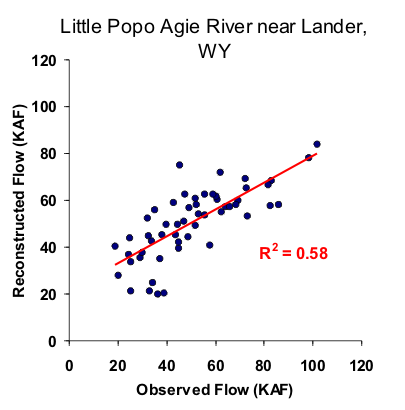
Figure 1. Scatter plot of observed and reconstructed Little Popo Agie River annual flow, 1946-1999.
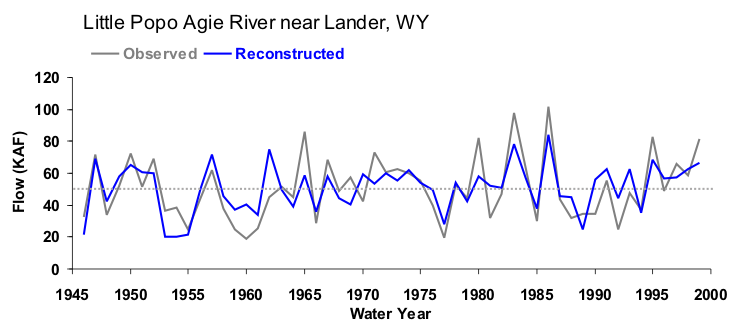
Figure 2. Observed (black) and reconstructed (blue) annual Little Popo Agie River annual flow, 1946-1999. The observed mean is shown by the dashed line.
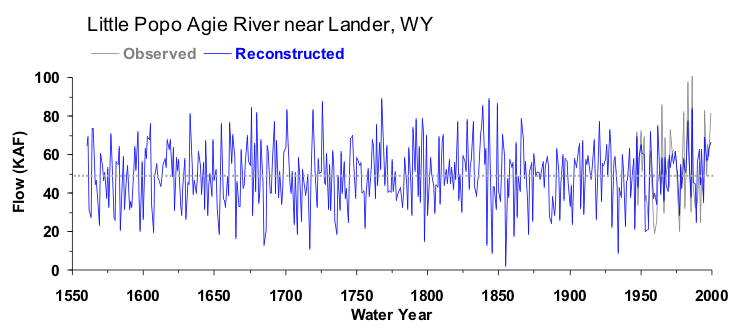
Figure 3. Reconstructed annual flow for the Little Popo Agie River (1560-1999) is shown in blue. Observed flow is shown in gray and the long-term reconstructed mean is shown by the dashed line.
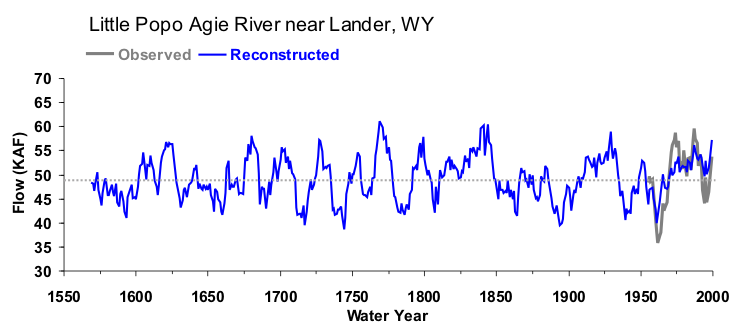
Figure 4. The 10-year running mean (plotted on final year) of reconstructed Little Popo Agie River flow, 1560-1999. Reconstructed values are shown in blue and observed values are shown in gray. The long-term reconstructed mean is shown by the dashed line.

