
N. Fork of South Platte River at South Platte, CO
The South Platte River is the primary water supply for the Denver metro area (Denver Water). The gage above Cheesman Lake is upstream of most augmentation from west-slope diversions and represents the flows from upper basin of the mainstem South Platte. In 2002, Connie Woodhouse developed a tree-ring reconstruction of this gage, which extends only through 1987 because key predictor chronologies available at that time ended in that year. Given the chronologies currently available, this reconstruction could be re-calibrated and extended through 2002. This reconstruction was used for the analyses in Woodhouse and Lukas (2006).
References:
Woodhouse, C.A. and J.J. Lukas. 2006. Multi-century tree-ring reconstructions of Colorado streamflow for water resource planning. Climatic Change 78: 293-315.
Methods
A forward stepwise regression procedure was used to calibrate the observed flows with a pool of potential predictors consisting of tree-ring chronologies from Colorado (both east-slope and west-slope). The residual chronologies, with the low-order autocorrelation removed, were used. Five predictor chronologies were selected by the stepwise procedure for the reconstruction model. Validation statistics were computed using a leave-one-out (cross-validation) approach. For further details and analyses, see Woodhouse and Lukas (2006).
Predictors: Van Bibber (CO), Turkey Creek (CO), Dillon (CO), Cathedral Creek (CO), Unaweep Canyon (CO)
| Statistic | Calibration | Validation |
| Explained variance (R2) | 0.67 | |
| Reduction of Error (RE) | 0.61 | |
| Standard Error of the Estimate | 24,574 AF | |
| Root Mean Square Error (RMSE) | 25,548 AF |
(For explanations of these statistics, see this document (PDF), and also the Reconstruction Case Study page.)
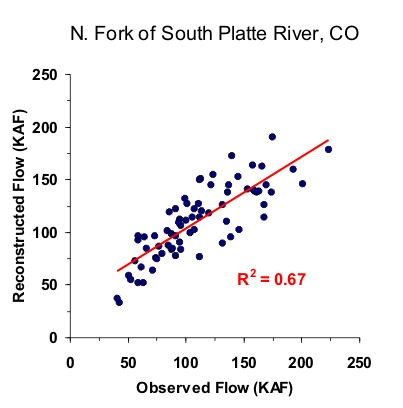
Figure 1. Scatterplot of observed and reconstructed N. Fork of South Platte River annual flow, 1916-1987.
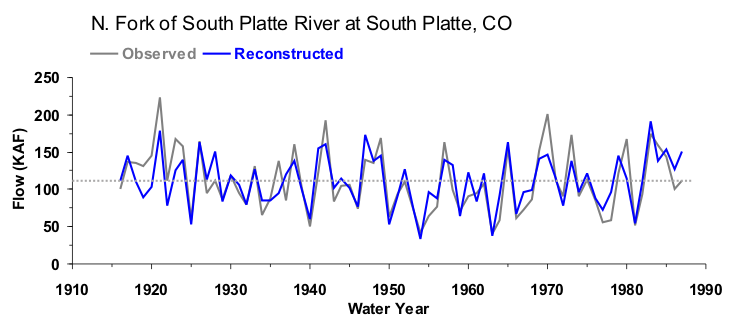
Figure 2. Observed (black) and reconstructed (blue) annual N. Fork of South Platte River annual flow, 1916-1987. The observed mean is illustrated by the dashed line.
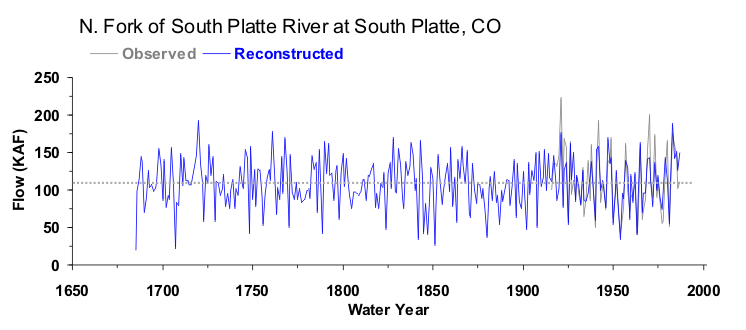
Figure 3. Reconstructed annual flow for the N. Fork of South Platte River (1685-1987) is shown in blue. Observed flow is shown in gray and the long-term reconstructed mean is shown by the dashed line.
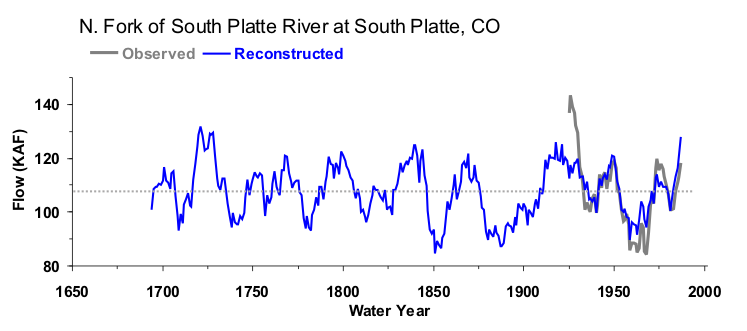
Figure 4. The 10-year running mean (plotted on final year) of reconstructed N. Fork of South Platte River flow, 1685-1987. Reconstructed values are shown in blue and observed values are shown in gray. The long-term reconstructed mean is shown by the dashed line.

