
Ojai
The precipitation gage at Ojai (NOAA co-op station 046399) is about 15 miles from the Pacific Coast, at an elevation of 745 feet. Ojai is located in Ventura County, northwest of Los Angeles, and the gage was selected to represent the South-Central coast. The precipitation data were obtained from the U.S. Historical Climatology Network for the years 1901-2014.
The reconstruction of water year precipitation at Ojai was generated as part of a project supported by the California Department of Water Resources (CADWR). This project includes reconstructions of water year precipitation (San Gabriel Dam, Lake Arrowhead, Ojai, and Cuyamaca) and streamflow (Arroyo Seco and Santa Ana River) for southern California and the Kern River in the southern Sierras. This set of reconstructions was developed by Dave Meko, Erica Bigio, and Connie Woodhouse in 2017, based on updated and new collections of tree-ring data in California sampled for this project.
Methods
Total water year (October-September) precipitation at Ojai was reconstructed using a two-stage regression procedure. Tree-growth at each site was first converted into an estimate of precipitation by stepwise regression of precipitation using tree-ring width indices, from the current year and lagged one year, as predictors. Squared terms on the tree-ring predictors were also included in the regression to allow for possible curvature in relationships between tree-growth and precipitation. In the second step, the gage reconstruction was generated by averaging an appropriate set of single site reconstructions. Final estimates of precipitation were interpolated from a piecewise-linear smoothed scatterplot of the observed precipitation values and the precipitation estimates averaged over the individual tree-ring sites. The procedure was repeated for subsets of tree-ring chronologies with different periods of common time coverage to build a “most-skillful” reconstruction, starting in the early 1400s, and a “longest” reconstruction, starting in the early 1100s. Details of the reconstruction method can be found here.
| Statistic | Most Skillful: Calibration | Most Skillful: Validation | Longest Model: Calibration | Longest Model: Validation |
| Explained variance (R2) | 0.67 | 0.53 | ||
| Reduction of Error (RE) | 0.73 | 0.51 | ||
| Standard Error of the Estimate | 5.002 in. | 6.758 in. | ||
| Root Mean Square Error (RMSE) | 5.170 in. | 7.020 in. |
Note: The statistics listed in the table represent average accuracy, while the reconstruction method yields error bars that vary in width over time -- generally wider for wet years than for dry years. The listed statistic R2, the decimal proportion of variance explained by the reconstruction in the calibration period, is computed directly from the reconstruction residuals. For an explanation of these statistics, see this document.
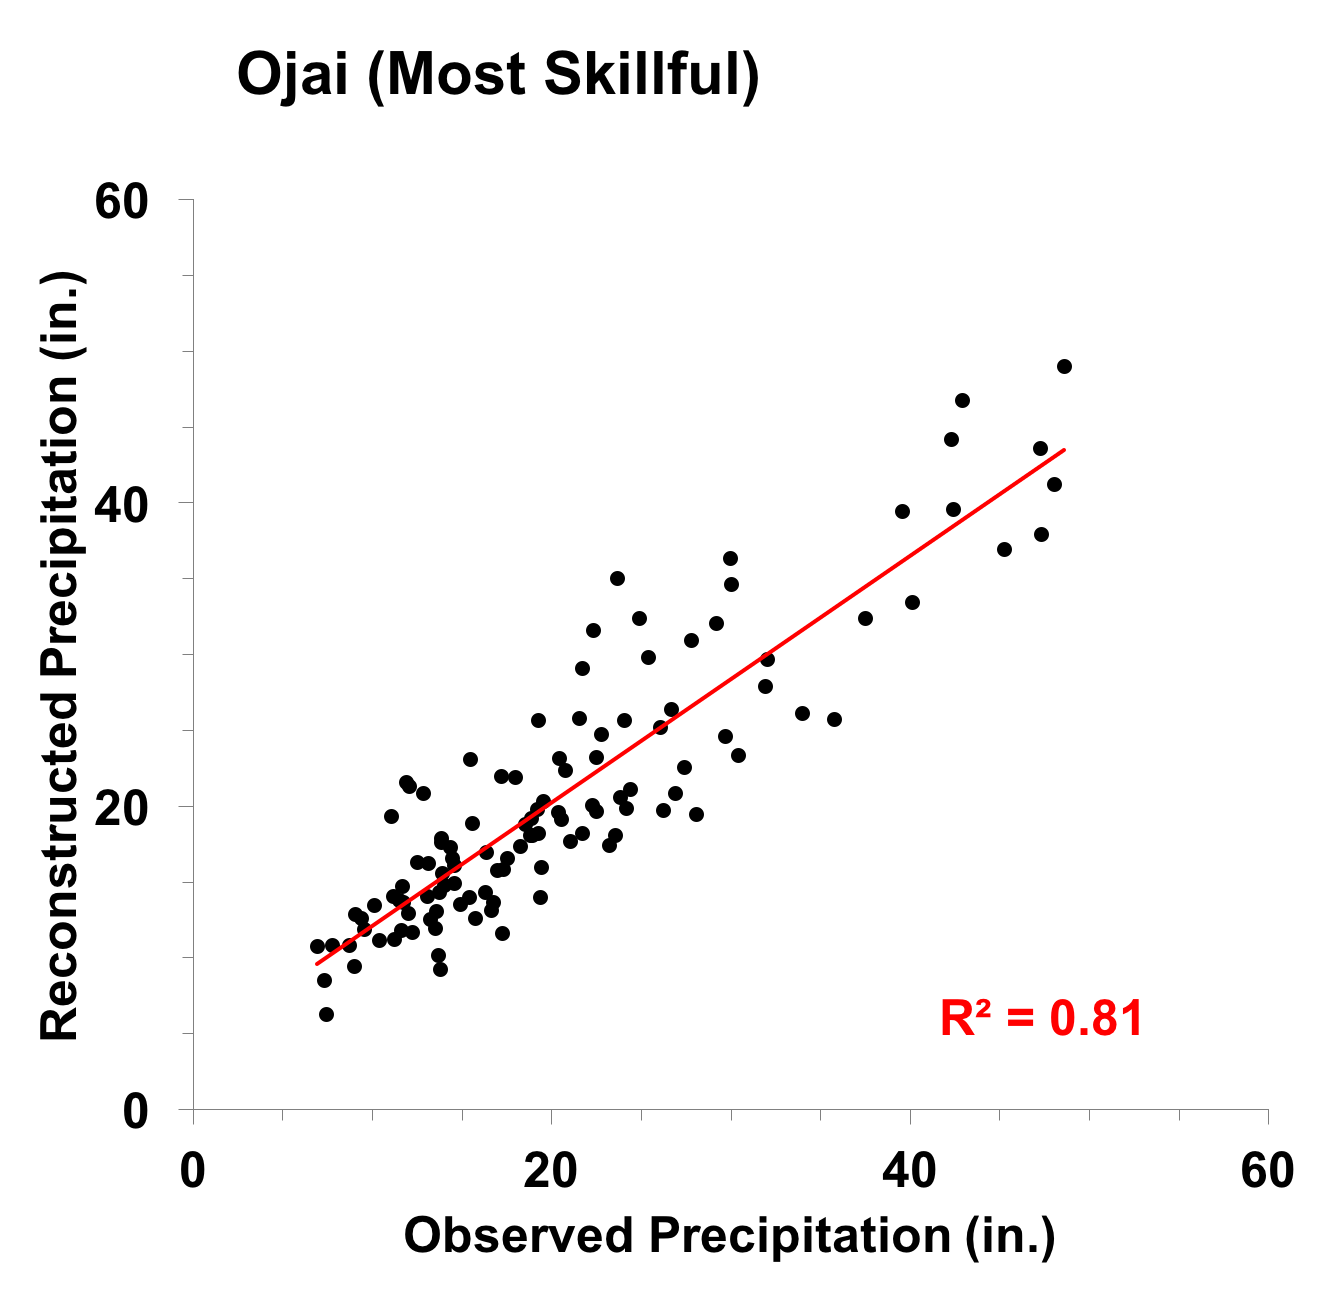
Figure 1. Scatter plot of observed and reconstructed Ojai annual precipitation, 1901-2014. Note that the R2 value here is slightly different than in the table. The table R2 value is the average explained variance from the three models that make up the most skillful reconstruction. The value in the scatter plot reflects the explained variance for the two models that cover the instrumental period (more details).
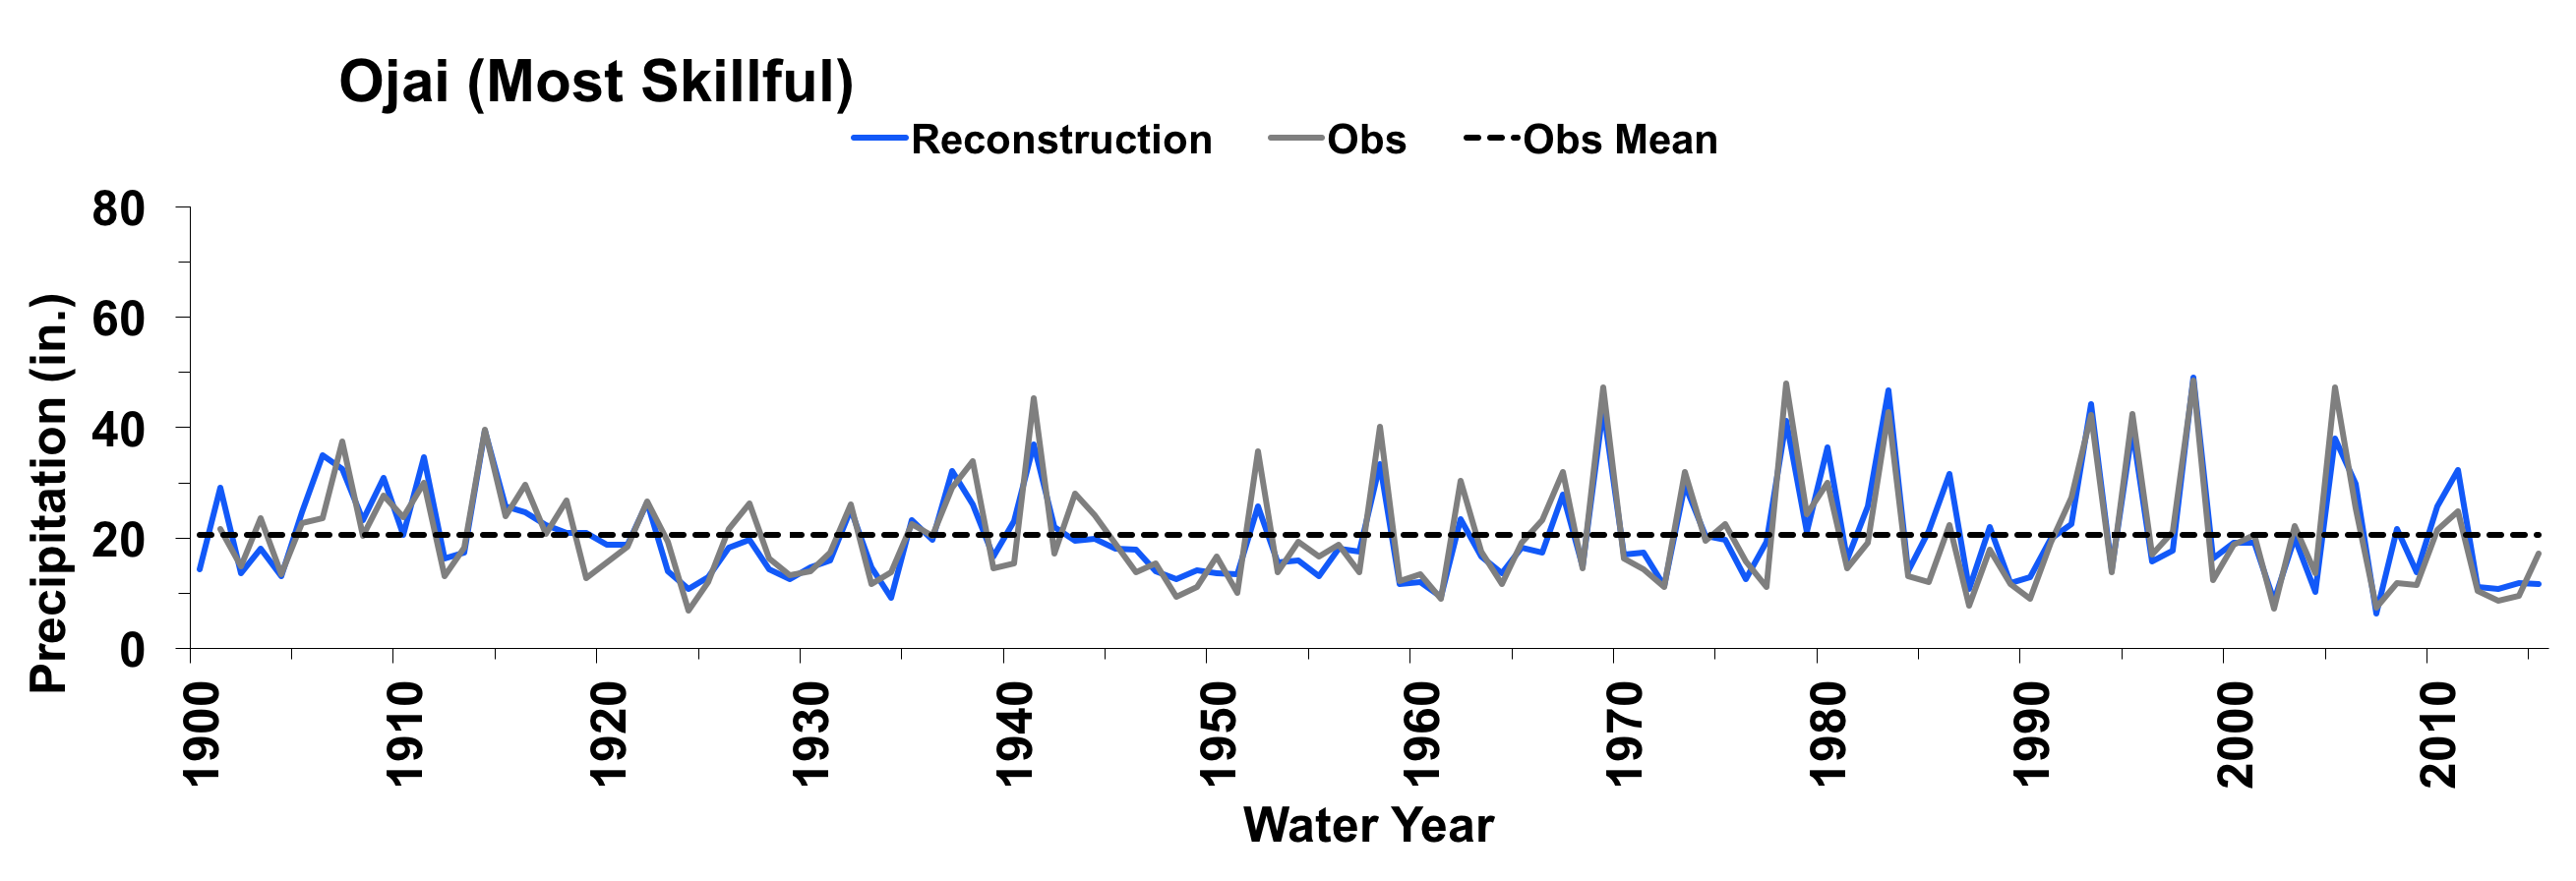
Figure 2. Observed (gray) 1901-2014, and reconstructed (blue) 1900-2016, Ojai annual precipitation. The observed mean is illustrated by the black dashed line.
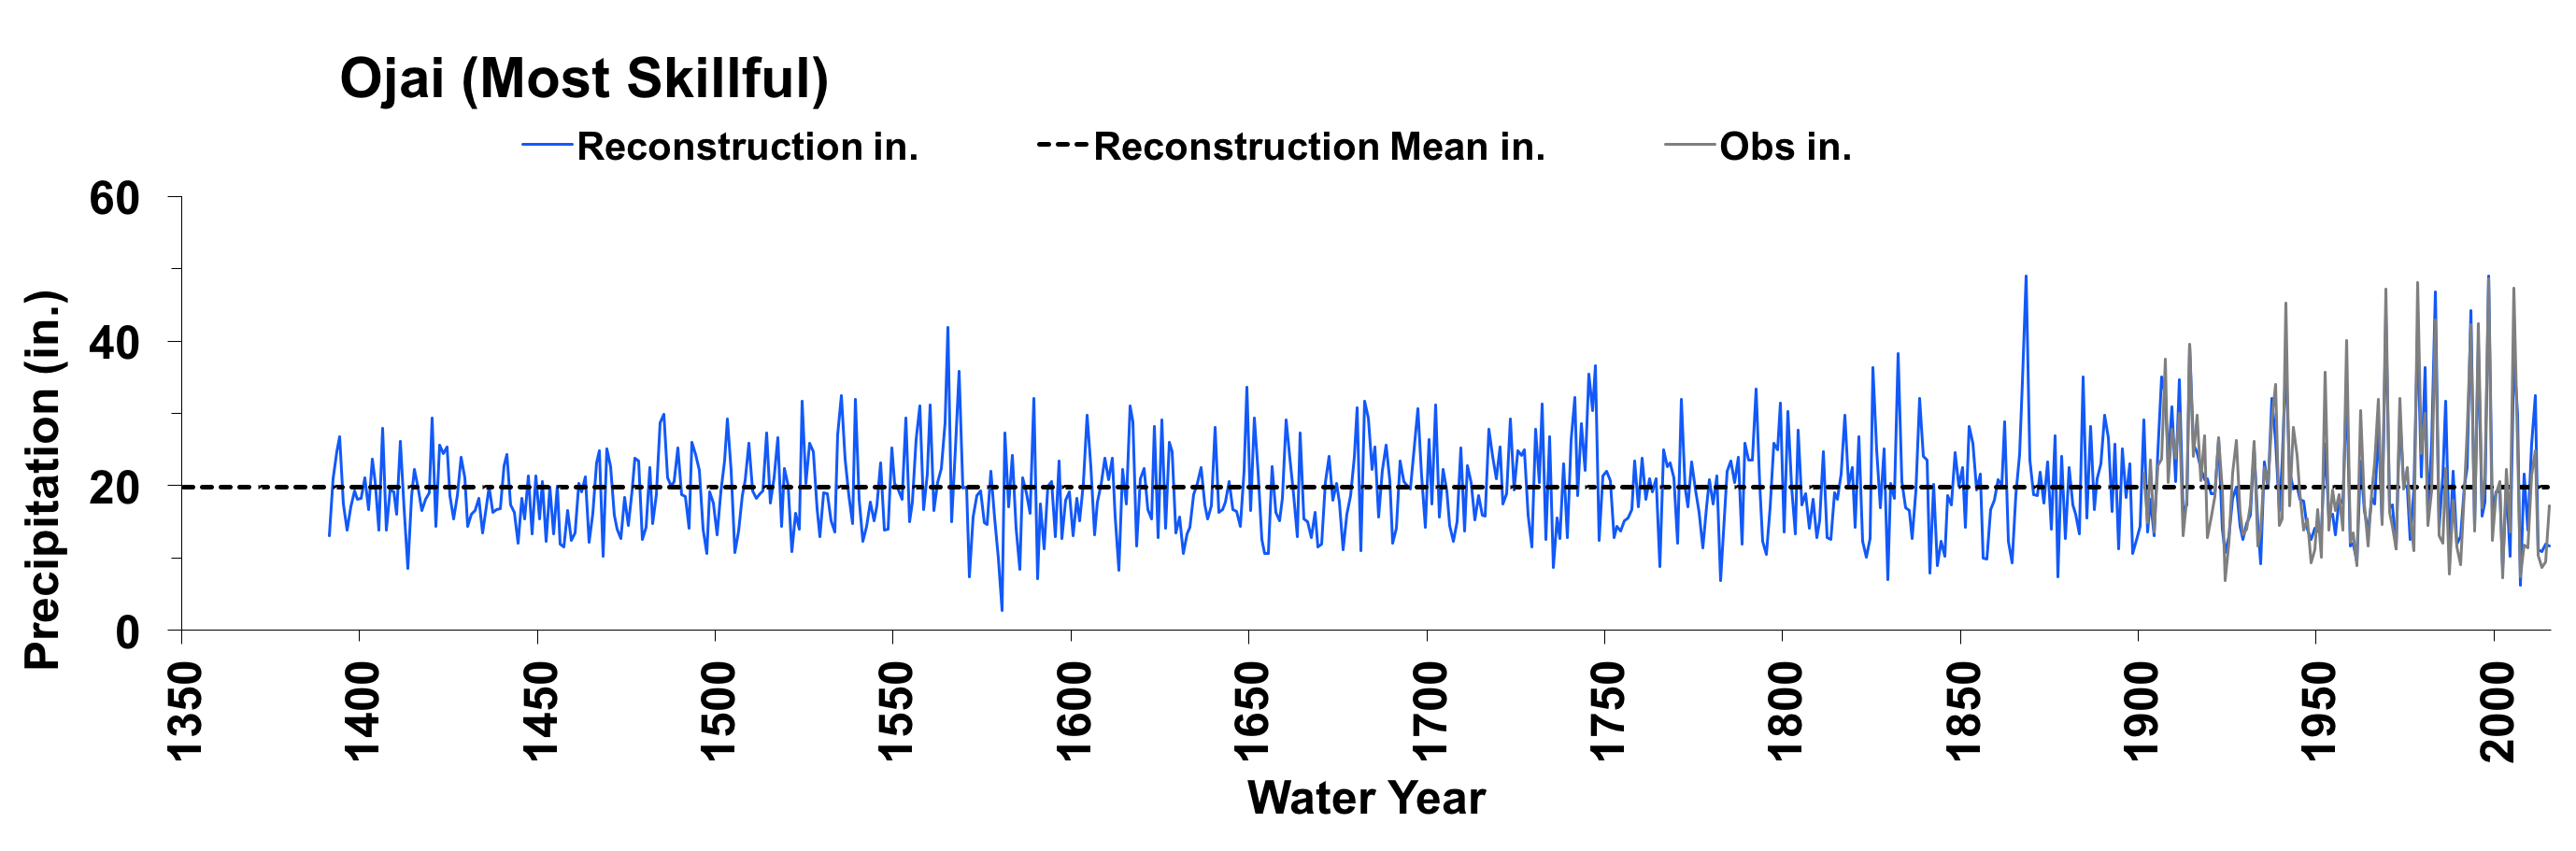
Figure 3. Reconstructed annual precipitation for the Ojai gage (1391-2016) is shown in blue. Observed flow is shown in gray and the long-term reconstructed mean is shown by the black dashed line.
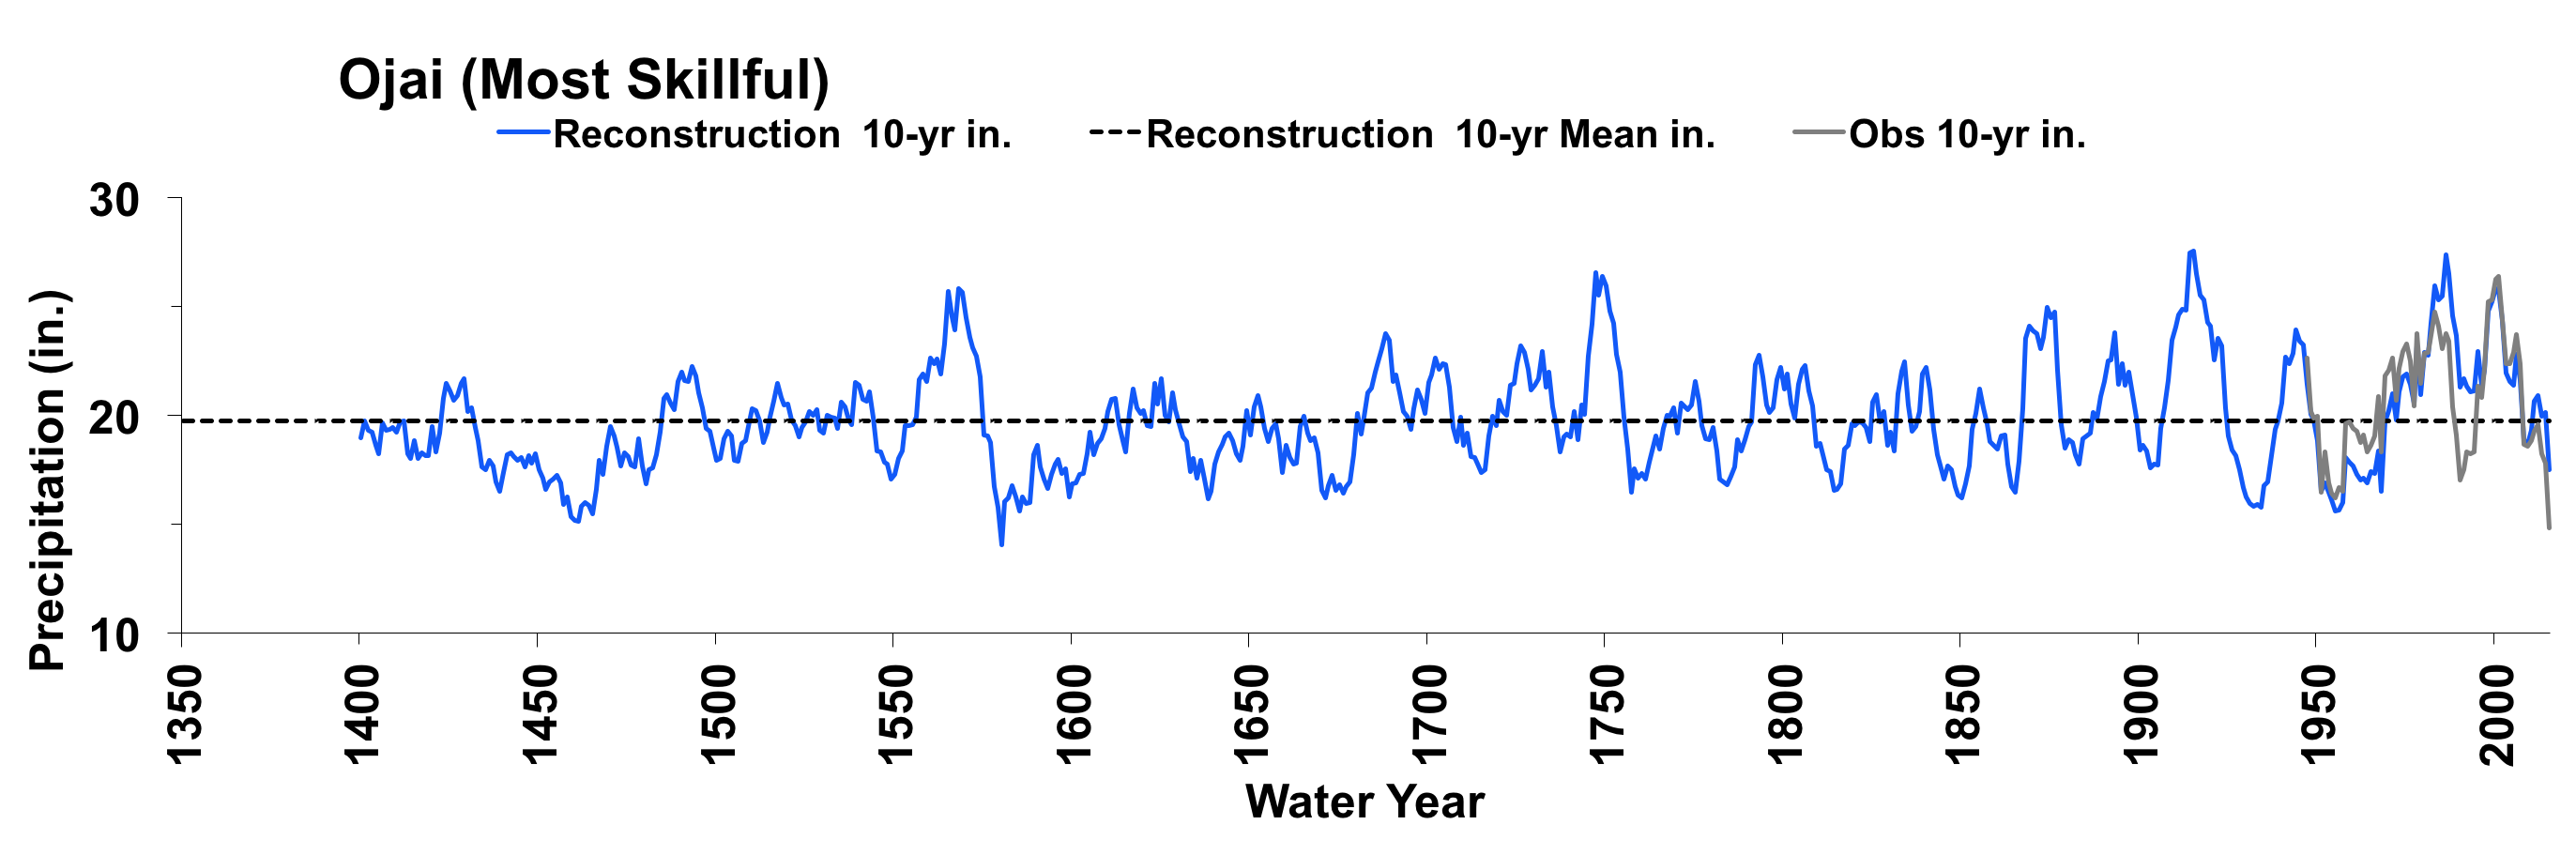
Figure 4. The 10-year running mean (plotted on final year) of reconstructed Ojai annual precipitation, 1391-2016. Reconstructed values are shown in blue and observed values are shown in gray. The long-term reconstructed mean is shown by the black dashed line.
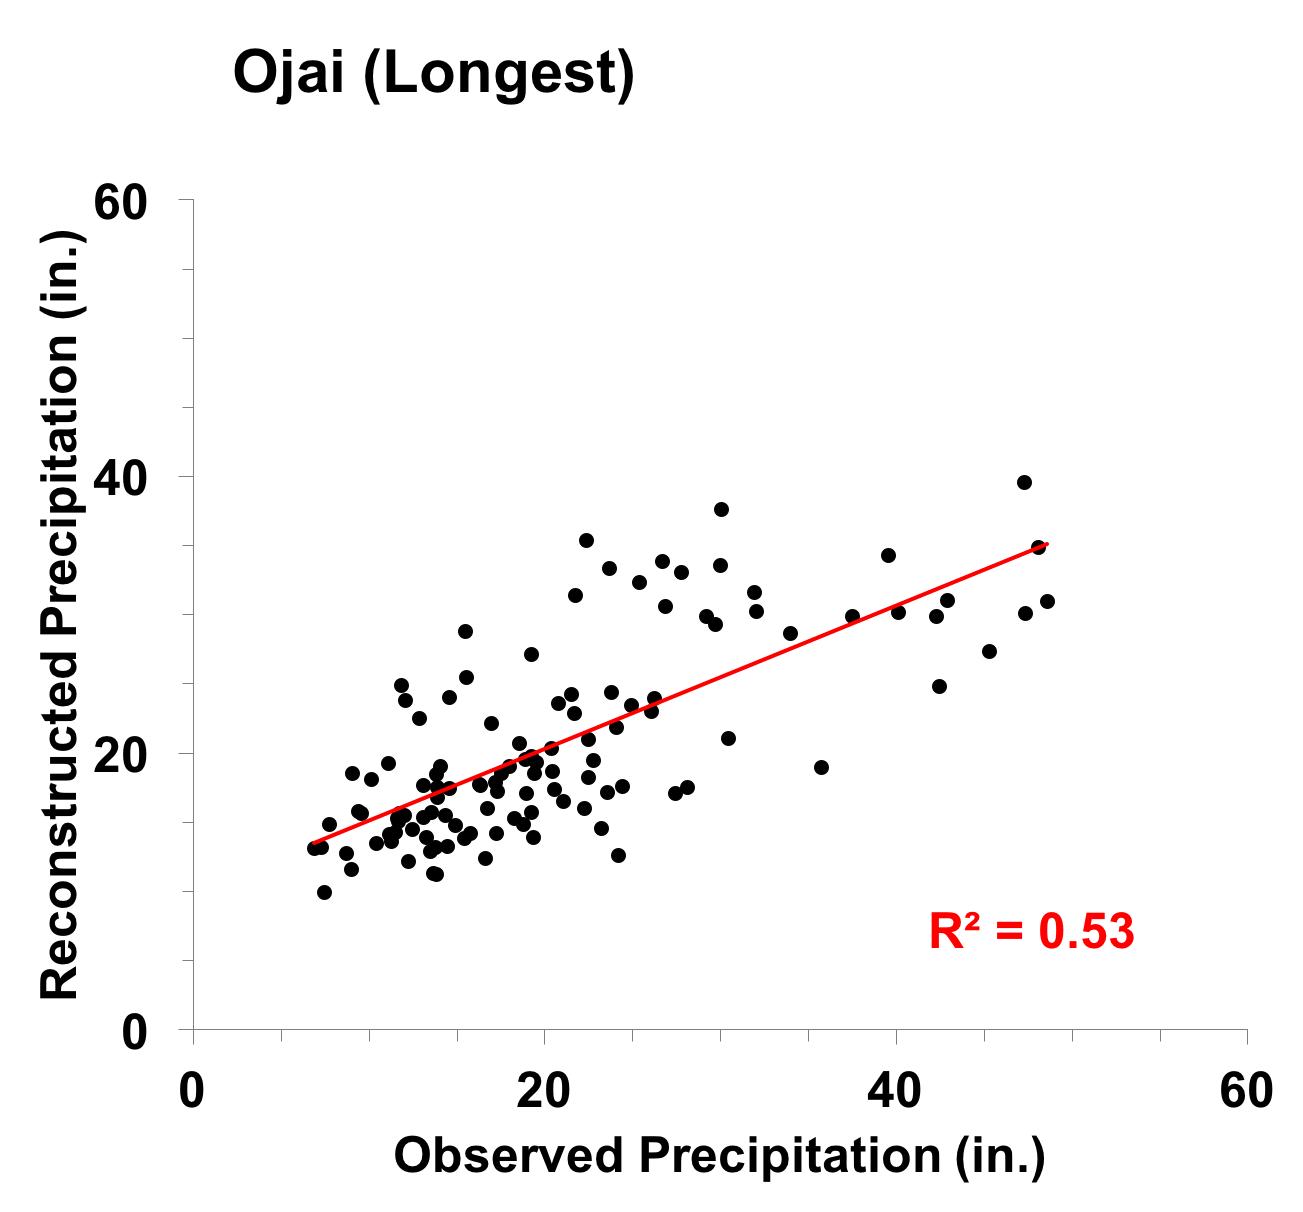
Figure 5. Scatter plot of observed and reconstructed Ojai annual precipitation, 1901-2014 (more details).
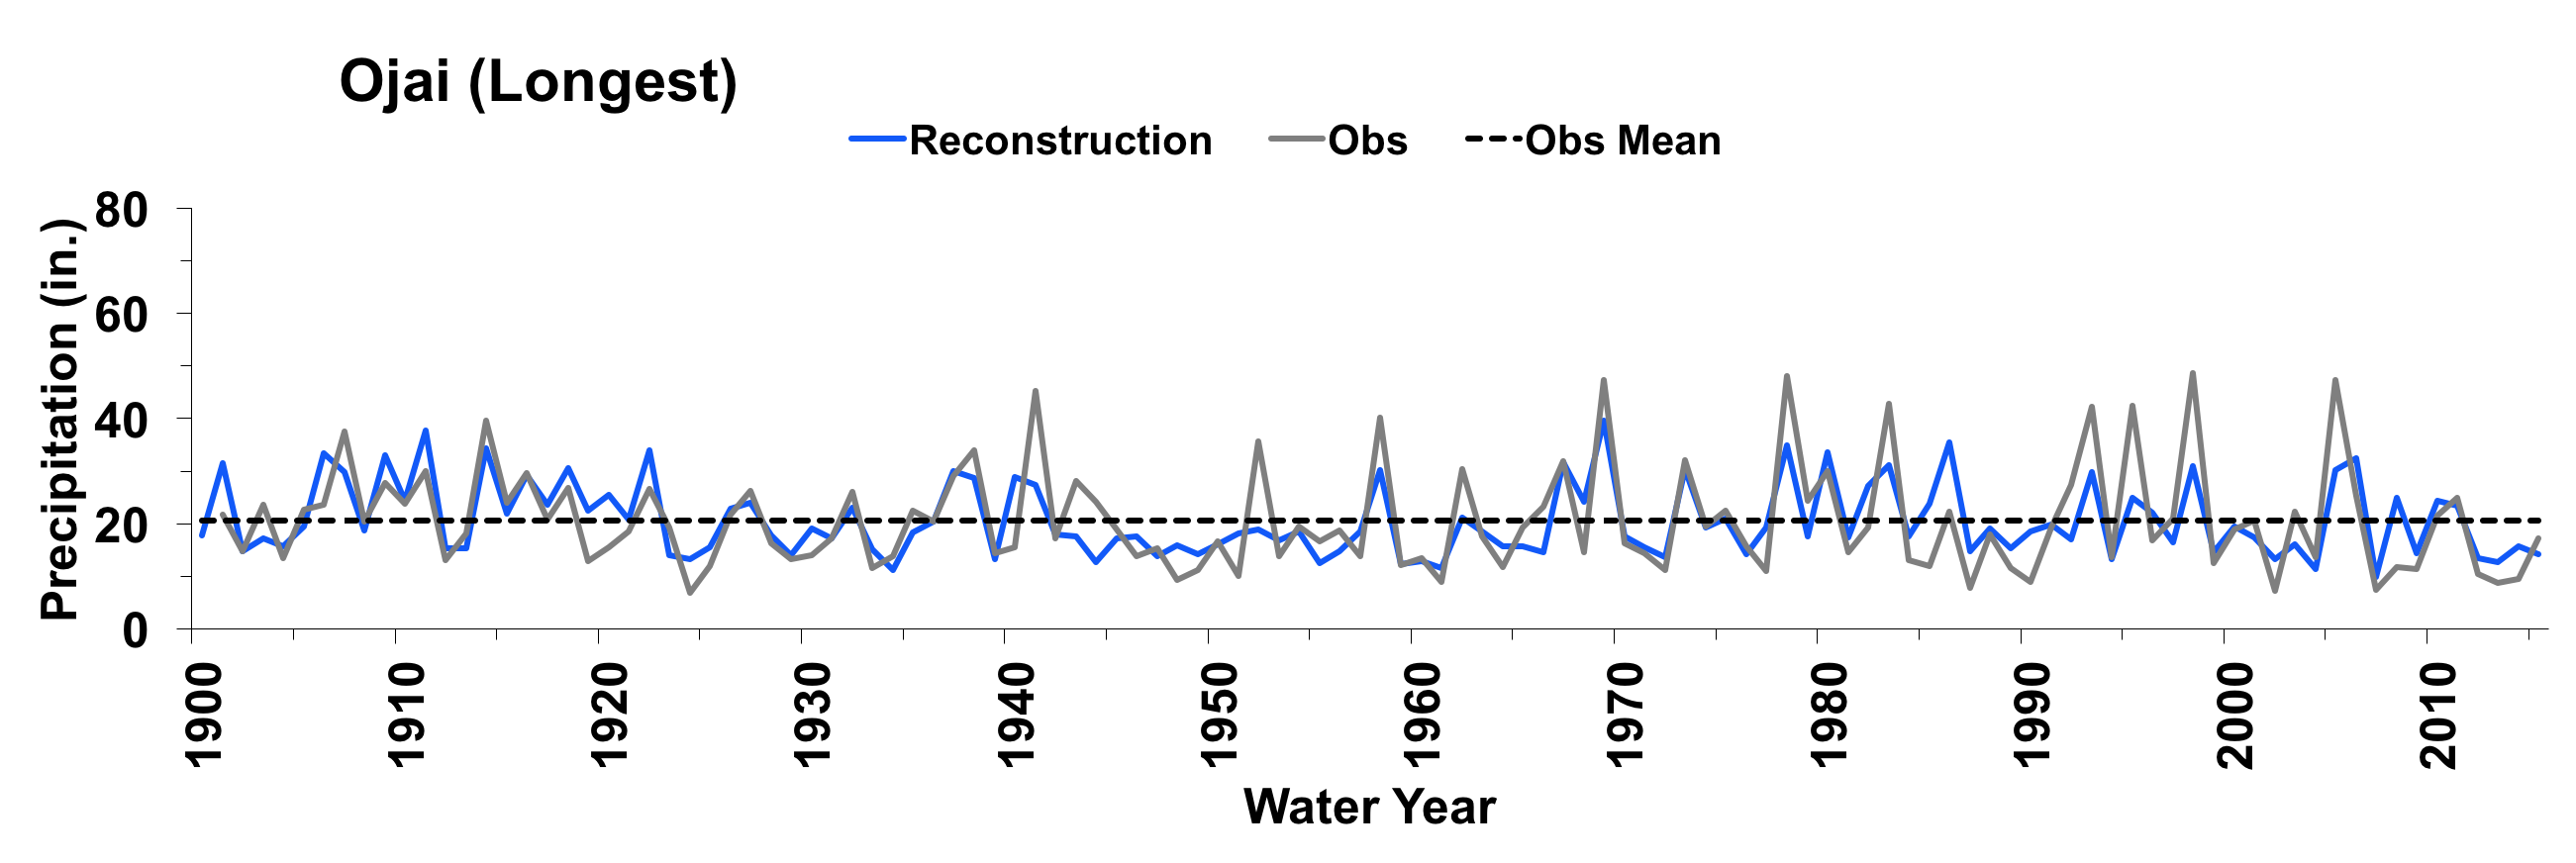
Figure 6. Observed (gray) 1901-2014, and reconstructed (blue) 1900-2016, Ojai annual precipitation. The observed mean is illustrated by the black dashed line.
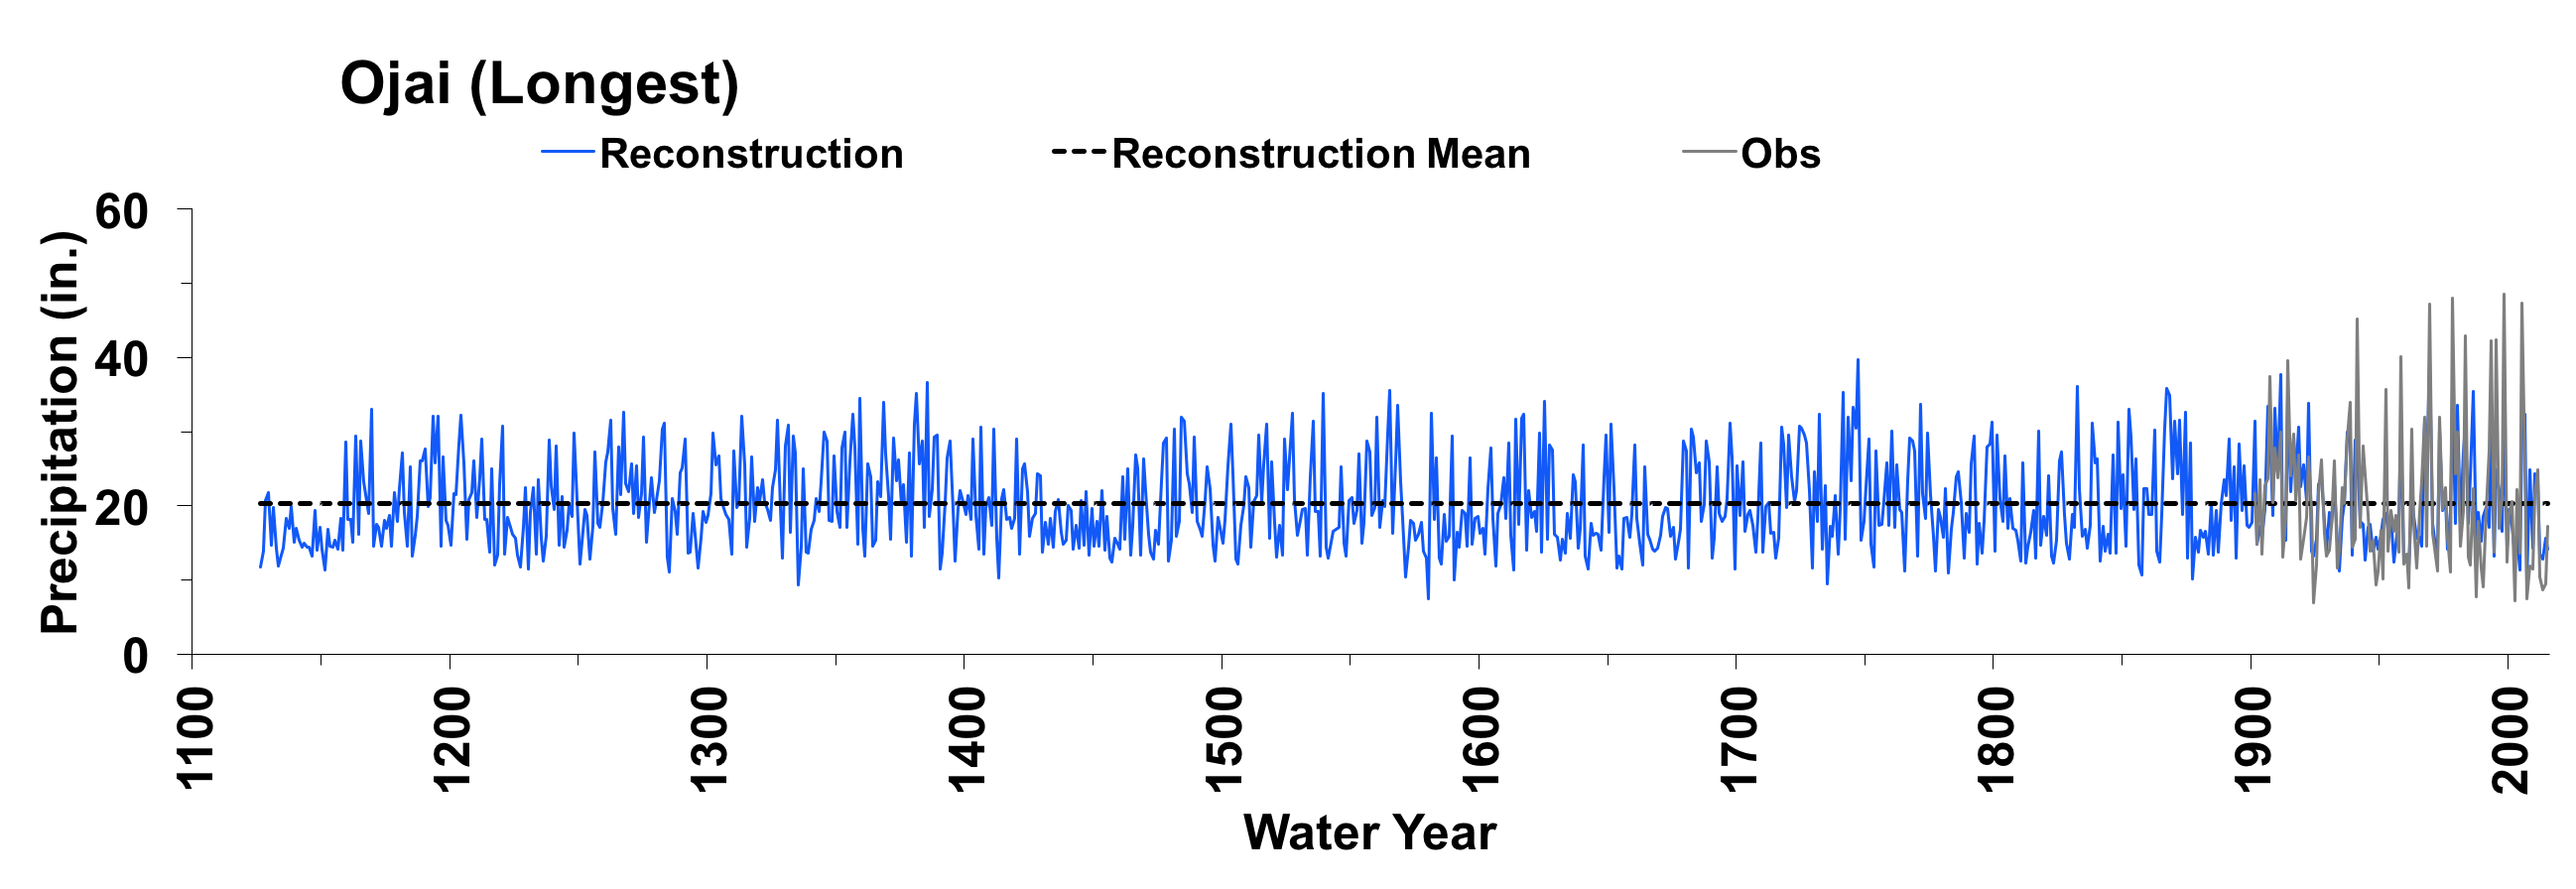
Figure 7. Reconstructed annual flow for the Ojai annual precipitation (1126-2015) is shown in blue. Observed flow is shown in gray and the long-term reconstructed mean is shown by black dashed line.
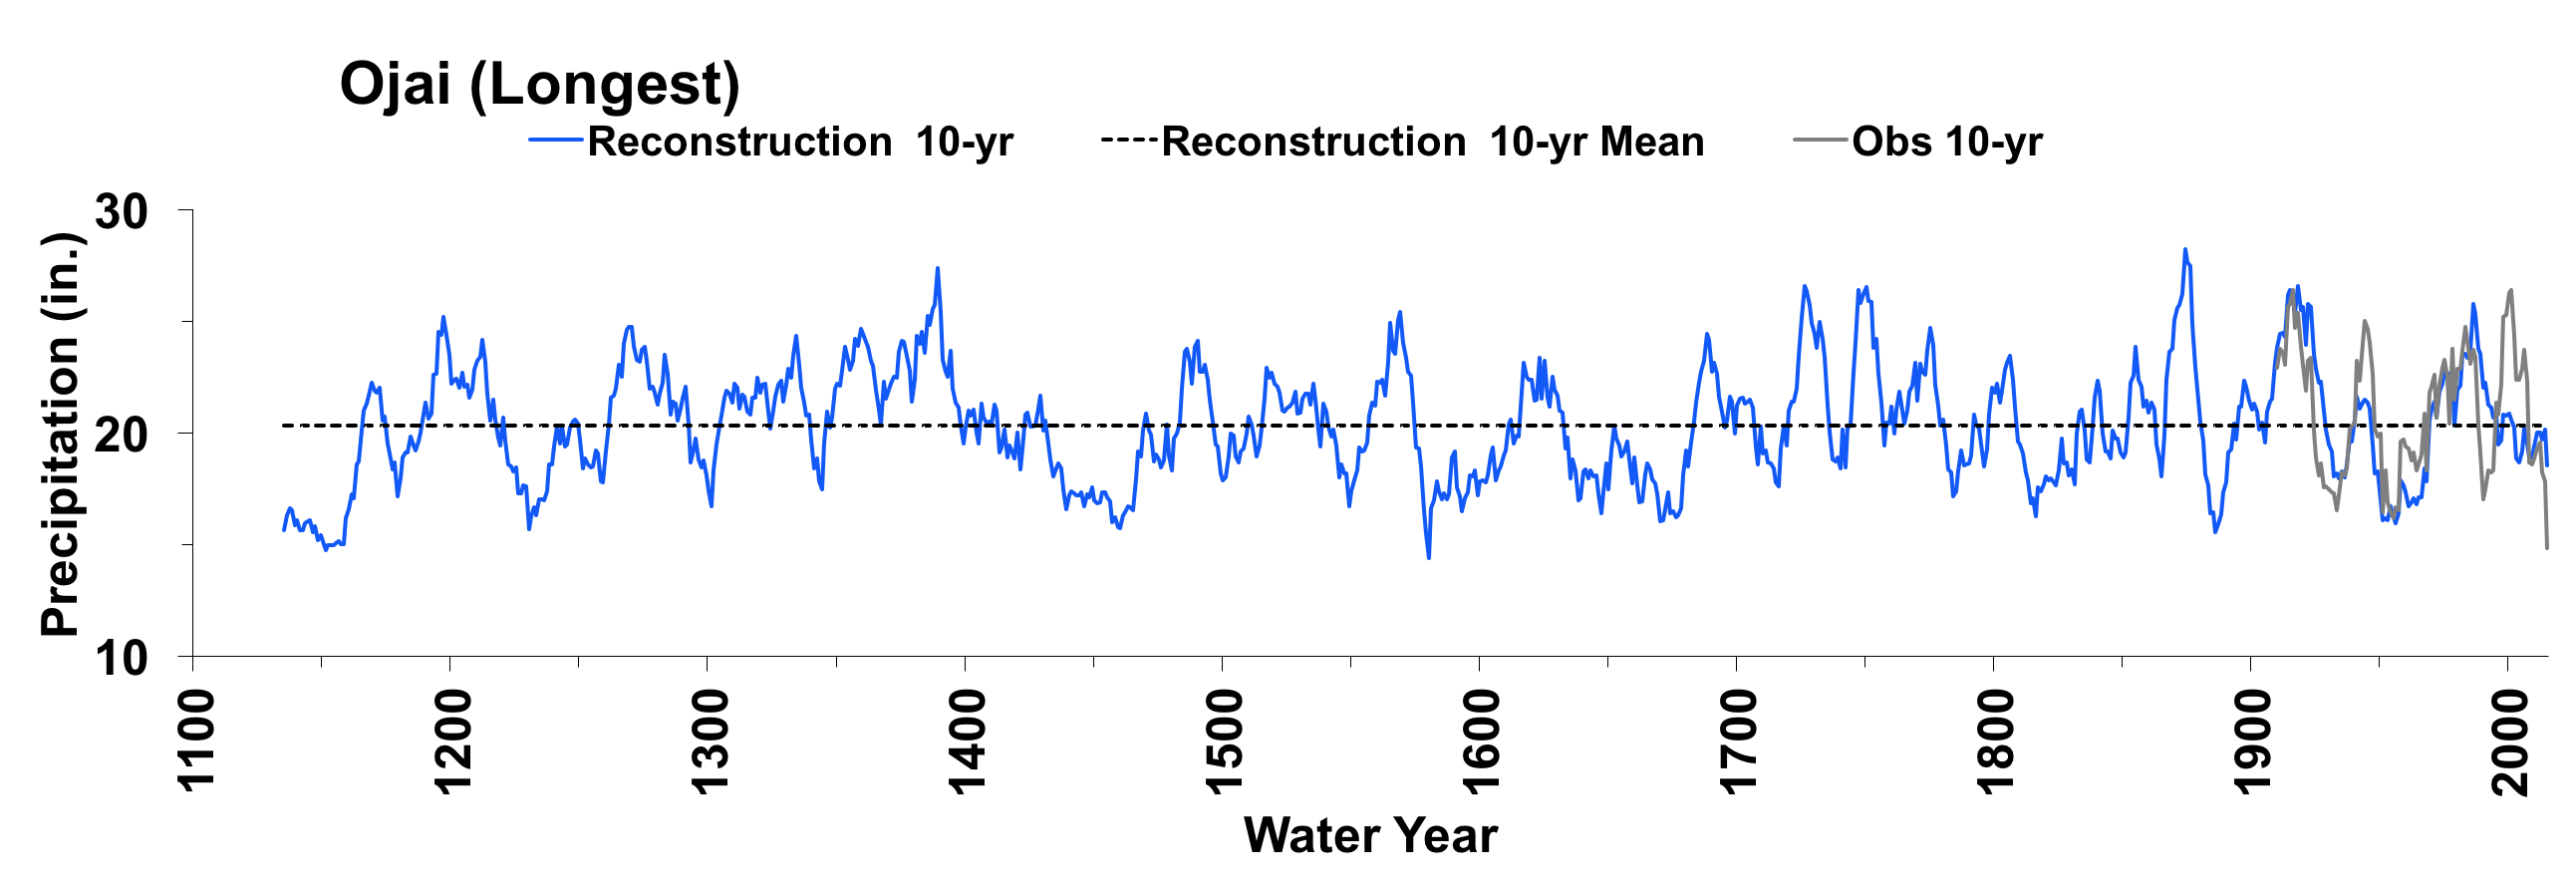
Figure 8. The 10-year running mean (plotted on final year) of observed Ojai annual precipitation, 1126-2015, is shown in gray. Reconstructed Ojai annual precipitation values are shown in blue. And the long-term reconstructed mean is shown by the black dashed line.

