
Pine Creek above Fremont Lake, WY
The upper Green River Basin, almost entirely in Wyoming, contributes about 15% of the total flow in the upper Colorado River Basin. Over the years, the upper Green River basin has not seen the same level of tree-ring sampling and chronology development as the rest of the Colorado River basin. In part because of the scarcity of tree-ring data within the basin, the few previous reconstructions for the mainstem upper Green (Stockton and Jacoby 1976, Woodhouse et al. 2006) explained only 45-50% of the variance in observed flow.
In 2005-2007, Anthony Barnett, Glenn Tootle, Steve Gray, and colleagues at the University of Wyoming conducted a research effort to collect new chronologies in the upper Green River basin and generate streamflow reconstructions for the mainstem Green River and its headwater tributaries. Their work resulted in eight reconstructions of annual (water-year) streamflow, which are all archived in TreeFlow, including the Pine Creek above Fremont Lake reconstuction.
References:
Barnett, F. A. 2007. Upper Green River Basin Streamflow Reconstructions and Drought Variability. M.S. Thesis, Department of Civil and Architectural Engineering, University of Wyoming, 118 pp.
Barnett, F.A., T.A. Watson, G.A. Tootle and S.T. Gray. In Press. Upper Green River Basin (USA) streamflow reconstructions. Journal of Hydrologic Engineering.
Methods
A forward stepwise linear regression procedure was used to calibrate the observed flow record with a pool of potential predictors consisting of tree-ring chronologies from Colorado, Wyoming, and Utah that were pre-screened for significant (r > 0.3) relationships with the observed record. The residual chronologies, with the low-order autocorrelation removed, were used. Two predictor chronologies were selected by the stepwise procedure for the reconstruction model. Validation statistics were computed using a leave-one-out (cross-validation) approach.
Predictor Chronologies: Fremont Lake (WY), Green Mountain Reservoir (CO)
| Statistic | Calibration | Validation |
| Explained variance (R2) | 0.53 | |
| Reduction of Error (RE) | 0.48 | |
| Standard Error of the Estimate | 20 KAF | |
| Root Mean Square Error (RMSE) | 21 KAF |
(For explanations of these statistics, see this document (PDF), and also the Reconstruction Case Study page.)
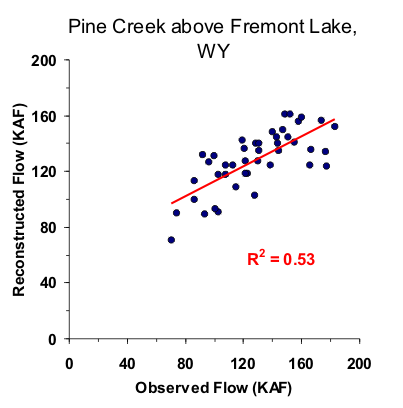
Figure 1. Scatter plot of observed and reconstructed Pine Creek annual flow, 1955-1997.
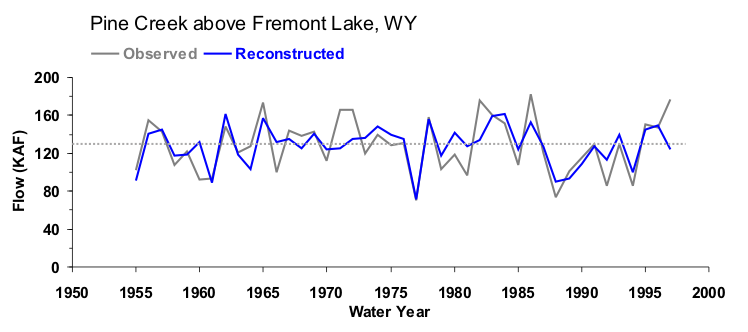
Figure 2. Observed (black) and reconstructed (blue) annual Pine Creek annual flow, 1955-1997. The observed mean is shown by the dashed line.
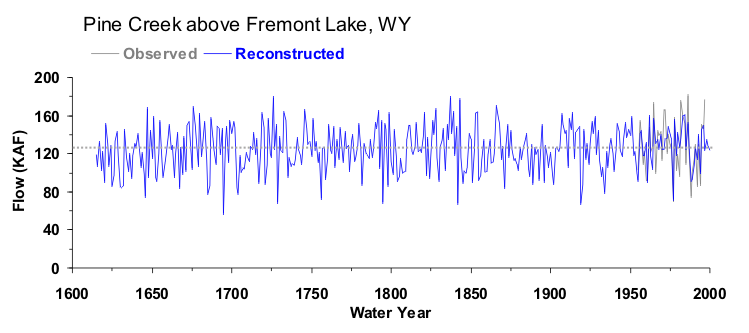
Figure 3. Reconstructed annual flow for Pine Creek (1615-1999) is shown in blue. Observed flow is shown in gray and the long-term reconstructed mean is shown by the dashed line.
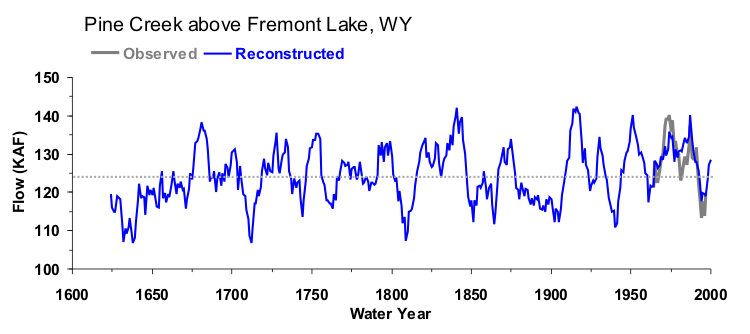
Figure 4. The 10-year running mean (plotted on final year) of reconstructed Pine Creek flow, 1615-1999. Reconstructed values are shown in blue and observed values are shown in gray. The long-term reconstructed mean is shown by the dashed line.

