
Potomac River at Point of Rocks, MD
The Potomac River is the primary water resource for the Washington, DC metropolitan area, supplying ~75% of the water demand for nearly 4 million residents. Water resources in the region are generally abundant but periodic drought and pluvial events require careful management of the water resources and the surrounding watersheds to minimize the negative impact of changes in water quantity and quality. The low-flow period extending from July to November is a primary concern of water resource managers.Two reservoirs located upstream of the Point of Rocks gage, the Savage and Jennings-Randolph Reservoirs, are used to augment Potomac River streamflow when water demand exceeds supply during the summer-fall low-flow period.
Stockton Maxwell, Amy Hessl, Ed Cook, and Neil Pederson used a large multi-species network of tree-ring chronologies from the region to generate a reconstruction of May–September streamflow for the Potomac River at Point of Rocks, Maryland (Maxwell et al. 2011). Point of Rocks is the longest available gaged record of Potomac River streamflow, and is relied upon for water resource monitoring and planning in the region. In 1983, Cook and Gordon Jacoby had reconstructed the July–September streamflow for this gage, from 1730–1977. This new reconstruction has an expanded seasonal window, lengthens the record by 780 years, and better replicates the mean and variance of the instrumental record.
References:
Maxwell, R. S., A. E. Hessl, E. R. Cook, and N. Pederson. 2011. A multispecies tree ring reconstruction of Potomac River streamflow (950–2001). Water Resources Research, 47, W05512, doi:10.1029/2010WR010019.
Methods
A set of 27 tree-ring chronologies from Maryland, Pennsylvania, West Virginia, and Virginia was compiled, representing nine different tree species. All 27 chronologies extend back before 1700, and three extend back before 1000. Chronologies in both years t and t+1 were included in the analysis, for a total of 54 candidate predictors, because of the known preconditioning effect of previous-year water availability on current-year growth in the mid-Atlantic region. The residual chronologies, from which low-order persistence has been removed, were used.
A nested principal components regression (PCR) model was used to reconstruct mean May–September Potomac River streamflow and account for the decrease in the number of predictor chronologies backward in time. Such time-varying models utilize the available tree ring chronologies in a period to gain greater predictive skill while lengthening the reconstruction. In this study, the first model was calibrated for the common period of all chronologies (1700–1976). A second model was calibrated one 25 year time step earlier (1675–1976), or when the next chronology drops out, using fewer chronologies available for the longer period, and so forth. An additional time step from 1700–2001 was modeled to include more recent tree ring collections. This resulted in a total of 12 separate regression model runs, each with its own set of calibration and verification statistics. Then, the models were spliced together to estimate streamflow back in time utilizing the near-maximum number of predictor chronologies available for each time step.
Predictors entered the PCR model if they were significantly correlated (r > |0.025|; p < 0.10) with mean May–September streamflow during the calibration period (1931–1976). A principal components analysis (PCA) was calculated on the remaining pool of predictors. The first n eigenvectors with eigenvalues >1 were retained for the multiple regression, further reducing the dimensionality of the data. The period of overlap between the instrumental record of streamflow and tree ring chronologies (1907–1976) was split into two periods for calibration (1931–1976) and verification (1907–1931) of the nested PCR models. The calibration models were verified with two rigorous tests of fit, the reduction of error statistic (RE) and the coefficient of efficiency (CE). For more details on the reconstruction methods, see Maxwell et al. (2011).
1700-1976 model only
| Statistic | Calibration | Validation |
| Explained variance (R2), 1931-1976 | 0.53 | |
| Reduction of Error (RE), 1907-1931 | 0.25 |
See Figure 3 in Maxwell et al. (2011) for the calibration and validation statistics across the 12 nested PCR models.
(For explanations of these statistics, see this document (PDF), and also the Reconstruction Case Study page.)
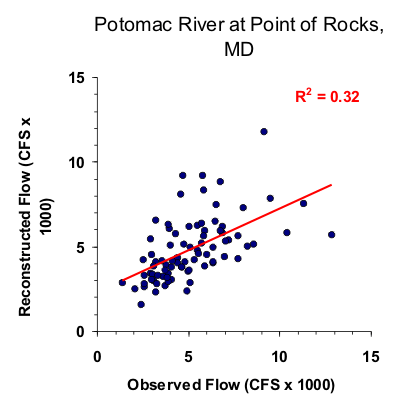
Figure 1. Scatter plot of observed and reconstructed Potomac River May–September streamflow over the calibration-verification period of 1907-1977.
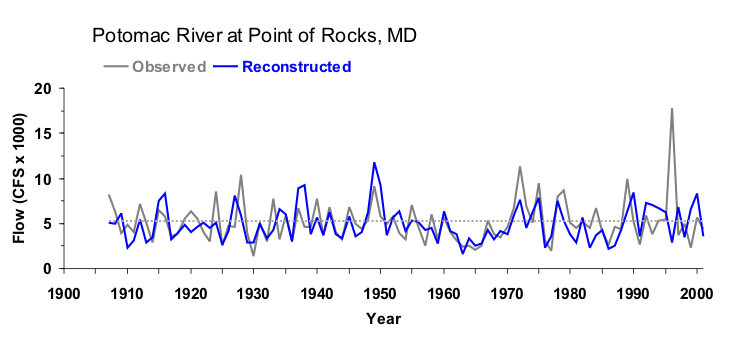
Figure 2. Observed (black) and reconstructed (blue) May–September Potomac River annual flow, 1907-2001. The observed mean is shown by the dashed line.
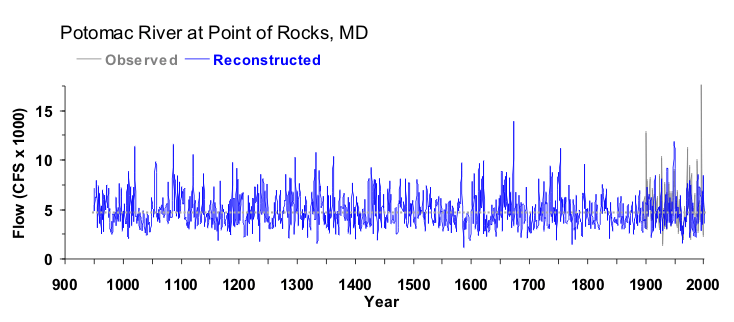
Figure 3. Reconstructed May–September flow for the Potomac River (950-2001) is shown in blue. Observed flow is shown in gray and the long-term reconstructed mean is shown by the dashed line.
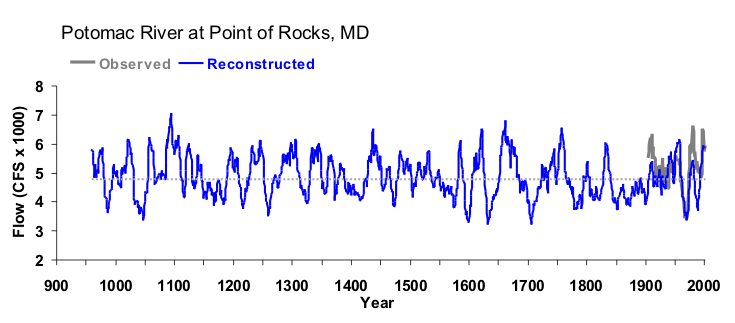
Figure 4. The 10-year running mean (plotted on final year) of reconstructed May–September flow for the Potomac River, 950-2001. Reconstructed values are shown in blue and observed values are shown in gray. The long-term reconstructed mean is shown by the dashed line.

