
Roaring Fork River at Glenwood Springs, CO
The Roaring Fork River is an important tributary of the Colorado River, and supports agricultural and municipal use in the Roaring Fork Valley. The basin is also part of the water supply for the Colorado Front Range urban area via the Fryingpan-Arkansas (Fry-Ark) project's reservoirs and diversion tunnels. Aurora Water uses the Roaring Fork at Glenwood Springs gage to represent contributions on the Fry-Ark to its water supply. In 2004, Connie Woodhouse developed the reconstruction of the Roaring Fork at the request of AMEC Earth and Environmental (formerly Hydrosphere), consultants for Aurora Water.
Methods
A forward stepwise regression procedure was used to calibrate the observed flow record with a pool of potential predictors consisting of ~30 tree-ring chronologies from western Colorado. The residual chronologies, with the low-order autocorrelation removed, were used. Five predictor chronologies were selected by the stepwise procedure for the reconstruction model for the Roaring Fork River at Glenwood Springs. Validation statistics were computed using a leave-one-out (cross-validation) approach.
Predictor Chronologies: Trail Gulch (CO), Dillon (CO), Gould Reservoir (CO), Red Canyon (CO), Sargents (CO), Rifle (CO), Pump House (CO)
| Statistic | Calibration | Validation |
| Explained variance (R2) | 0.69 | |
| Reduction of Error (RE) | 0.63 | |
| Standard Error of the Estimate | 163,400 AF | |
| Root Mean Square Error (RMSE) | 170,406 AF |
(For explanations of these statistics, see this document (PDF), and also the Reconstruction Case Study page.)
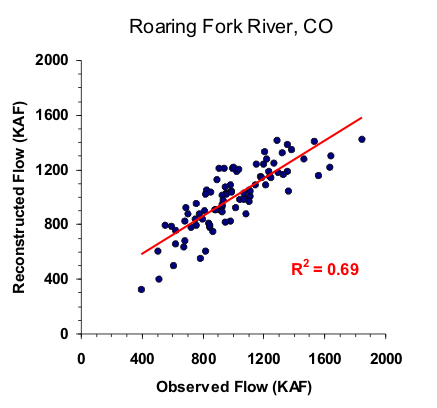
Figure 1. Scatter plot of observed and reconstructed Roaring Fork River annual flow, 1912-1999.
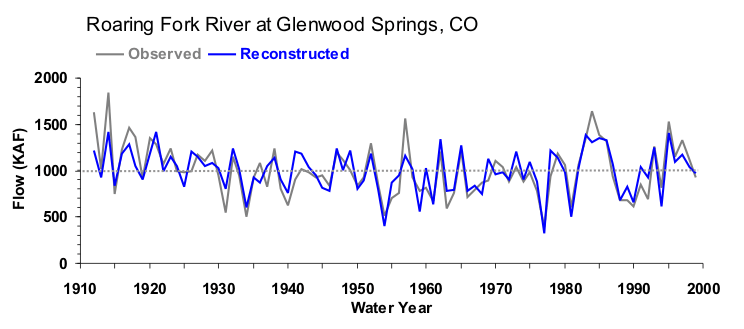
Figure 2. Observed (black) and reconstructed (blue) annual Roaring Fork River annual flow, 1912-1999. The observed mean is illustrated by the dashed line.
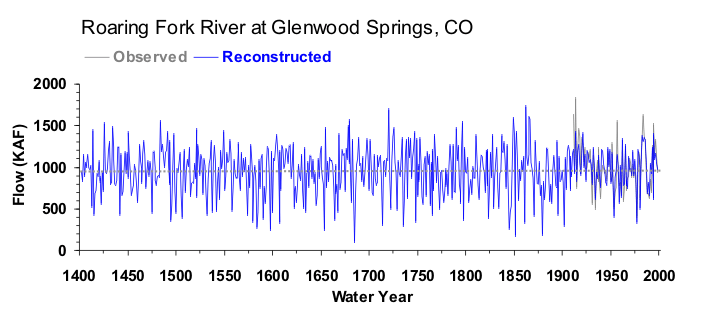
Figure 3. Reconstructed annual flow for the Roaring Fork River (1402-1999) is shown in blue. Observed flow is shown in gray and the long-term reconstructed mean is shown by the dashed line.
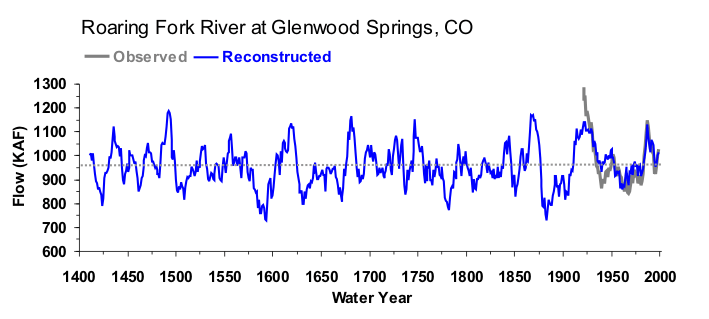
Figure 4. The 10-year running mean (plotted on final year) of reconstructed Roaring Fork River flow, 1402-1999. Reconstructed values are shown in blue and observed values are shown in gray. The long-term reconstructed mean is shown by the dashed line.

