
San Francisco Bay Salinity
Salinity in San Francisco Bay is controlled primarily by freshwater inflow from the Sacramento and San Joaquin rivers; during wet years with high discharge from those rivers into the bay, salinity decreases, and vice-versa. The same tree-ring chronologies that are useful for reconstructing Sacramento-San Joaquin streamflow can thus be useful for reconstructing the salinity of San Francisco Bay.
As part of the CALFED science program to support adaptive management of the Sacramento-San Joaquin Delta region and San Francisco Bay, David Stahle of the University of Arkansas developed a 400-year tree-ring reconstruction of San Francisco Bay salinity from moisture-stressed blue oak (Quercus douglasii) trees. Because the diversions since ~1950 from the Sacramento and San Joaquin rivers have reduced freshwater discharge into the Bay, the observed salinity record has a pronounced upward trend since ~1950 (see figure 2b below) and only the earlier portion of that record (1922-1952) was used to calibrate the reconstruction model. The reconstruction indicated that the recent elevated salinity values were unusual in the context of the past 400 years.
References:
Stahle, D.W., M.D. Therrell, M.K. Cleaveland, D.R. Cayan, M.D. Dettinger and N. Knowles. 2001. Ancient blue oaks reveal human impact on San Francisco Bay salinity. Eos, Transactions, American Geophysical Union. 82(12): 141, 144-145.
Methods
The simple mean of 5 blue oak tree-ring chronologies from central California was used as a single predictor in a linear regression against the observed salinity record from 1922-1952. Validation statistics were computed using a leave-one-out (cross-validation or PRESS) approach.
Predictor: Mean of these chronologies: Clear Lake State Park (CA), American River (CA), Mt. Diablo State Park (CA), Pacheco State Park (CA), Pinnacles National Monument (CA)
| Statistic | Calibration | Validation |
| Explained variance (R2) | 0.82 | |
| Reduction of Error (RE) | 0.80 | |
| Standard Error of the Estimate | 1.063 | |
| Root Mean Square Error (RMSE) | 1.086 |
(For explanations of these statistics, see this document (PDF), and also the Reconstruction Case Study page.)
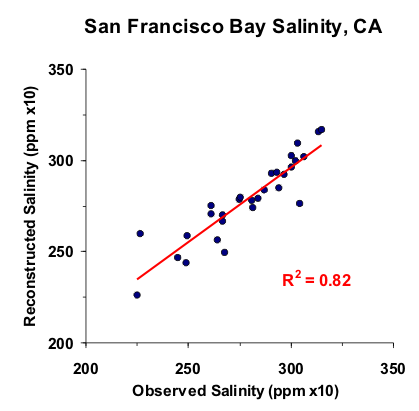
Figure 1. Scatter plot of observed and reconstructed San Francisco Bay annual salinity, 1922-1952.
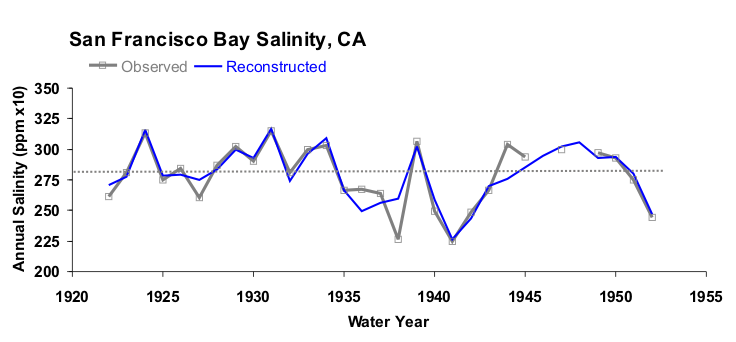
Figure 2a. Observed (black) and reconstructed (blue) San Francisco Bay annual salinity, 1922-1952. The observed mean is illustrated by the dashed line.
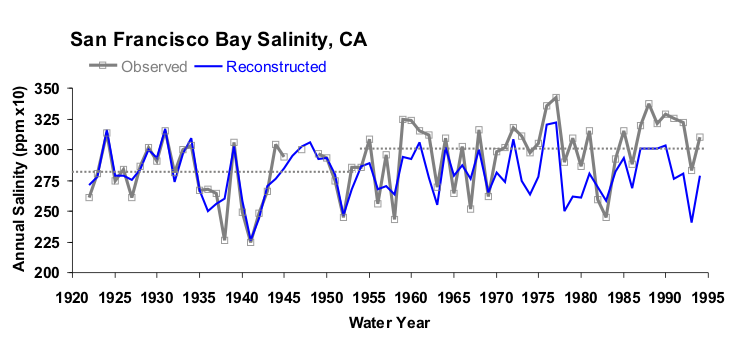
Figure 2b. Observed (black) and reconstructed (blue) San Francisco Bay annual salinity, 1922-1994. The observed means for 1922-1952 and 1953-1994, respectively, are shown by the dashed lines. The divergence of the reconstructed and observed salinity levels after 1952 is due to increasing diversions of the Sacramento and San Joaquin Rivers, raising salinity in the bay above what would be expected given the hydroclimatic variability being recorded by the trees.
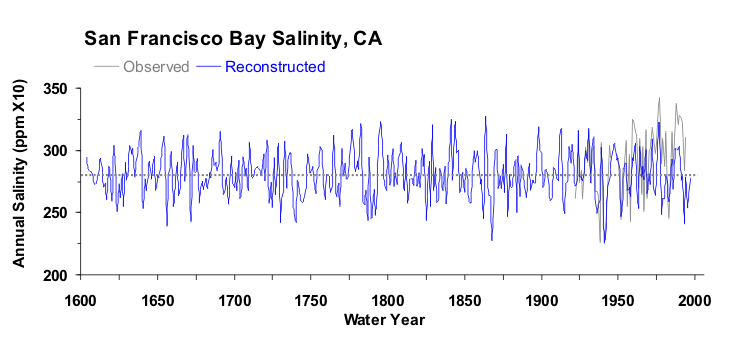
Figure 3. Reconstructed San Francisco Bay annual salinity (1604 -1997) is shown in blue. Observed salinity is shown in gray and the long-term reconstructed mean is shown by the dashed line.
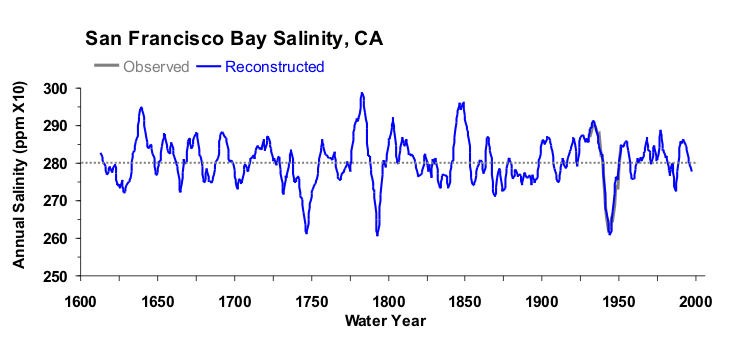
Figure 4. The 10-year running mean (plotted on final year) of San Francisco Bay annual salinity, 1604-1997. Reconstructed values are shown in blue and observed values are shown in gray. The long-term reconstructed mean is shown by the dashed line.

