
South Platte River at South Platte, CO
The South Platte River is the primary water supply for the Denver metro area (Denver Water), conveying both water originating in the basin and water diverted from the Blue River headwaters through the Roberts Tunnel. The gage at South Platte, CO is critical for monitoring Denver Water's supply, and includes the water entering from the North Fork of the South Platte. In 2002, Connie Woodhouse developed a tree-ring reconstruction of this gage, and then in 2004, Woodhouse updated the South Platte at South Platte reconstruction using more recently collected chronologies, so that the calibration would include the extreme drought year of 2002. The updated reconstruction is shown here. The earlier version of this reconstruction appears in Woodhouse and Lukas (2006a), and the updated version appears in Woodhouse and Lukas (2006b).
References:
Woodhouse, C.A. and J.J. Lukas. 2006a. Multi-century tree-ring reconstructions of Colorado streamflow for water resource planning. Climatic Change 78: 293-315.
Woodhouse, C.A. and J.J. Lukas. 2006b. Drought, Tree Rings, and Water Resource Management in Colorado. Canadian Water Resources Journal 31(4): 1-14
Methods
Because the observed flow record for the South Platte River at South Platte is skewed towards high flows, resulting in a non-linear relationship between the observed flow record and the tree-ring chronologies, the observed record was transformed into log 10 units prior to calibration. A forward stepwise regression procedure was used to calibrate the log-transformed observed flows with a pool of potential predictors consisting of tree-ring chronologies from Colorado (both east-slope and west-slope). The residual chronologies, with the low-order autocorrelation removed, were used. Six predictor chronologies were selected by the stepwise procedure for the reconstruction model. Validation statistics were computed using a leave-one-out (cross-validation) approach. After calibration and validation, the reconstructed flows were back-transformed from log units to the original units (acre-feet).
Predictors: Van Bibber Update - earlywood (CO), Pump House (CO), Turkey Creek Update (CO), Dillon (CO), Natural Arch (CO), Lands End (CO)
Note: the calibration and validation statistics below were computed during the model development and reflect the relationship between the log-transformed observed flow record and the tree-ring predictor. The scatterplot below in Figure 1 shows the relationship between the back-transformed observed flows and the reconstructed flows, which has a lower R2 than that reported in the table. Also, the Standard Error of the Estimate and Root Mean Square Error reported below are in log units, and the RMSE can't be used to compute confidence intervals.
| Statistic | Calibration | Validation |
| Explained variance (R2) | 0.76 | |
| Reduction of Error (RE) | 0.71 | |
| Standard Error of the Estimate | 0.098 | |
| Root Mean Square Error (RMSE) | 0.1021 |
(For explanations of these statistics, see this document (PDF), and also the Reconstruction Case Study page.)
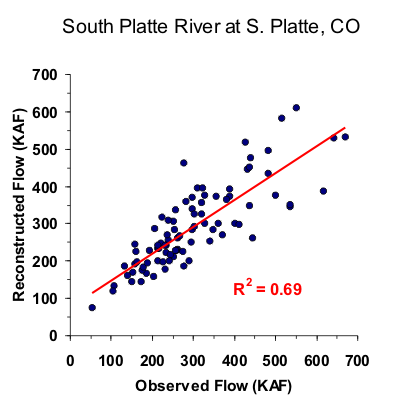
Figure 1. Scatterplot of observed and reconstructed South Platte River annual flow, 1916-2002.
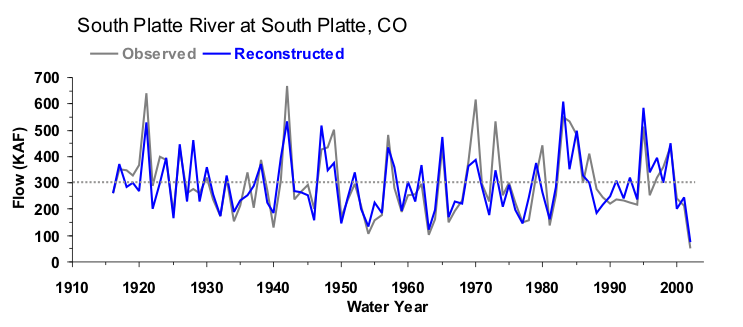
Figure 2. Observed (black) and reconstructed (blue) annual South Platte River annual flow, 1916-2002. The observed mean is illustrated by the dashed line.
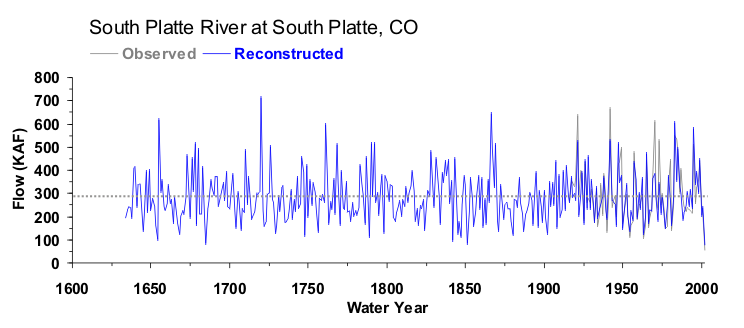
Figure 3. Reconstructed annual flow for the South Platte River (1634-2002) is shown in blue. Observed flow is shown in gray and the long-term reconstructed mean is shown by the dashed line.
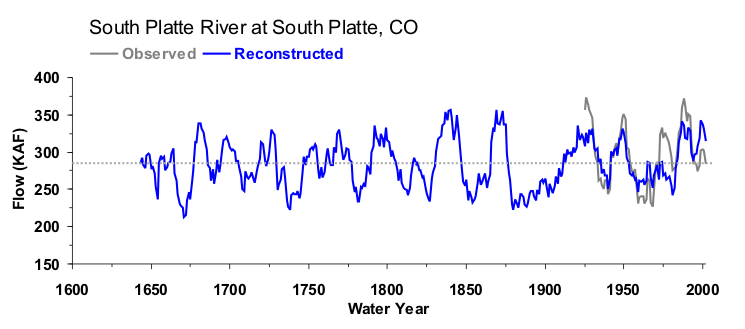
Figure 4. The 10-year running mean (plotted on final year) of reconstructed South Platte River flow, 1634-2002. Reconstructed values are shown in blue and observed values are shown in gray. The long-term reconstructed mean is shown by the dashed line.

