Wind River near Dubois, WY
The Wind River (which then becomes the Bighorn River) supplies water for 80,000 people and 600,000 acres of irrigated agriculture in north-central Wyoming. Much of the Wind River Basin lies within the Wind River Indian Reservation, home of the Northern Arapaho and Eastern Shoshone.
In 2005-2007, Tom Watson, Anthony Barnett, Glenn Tootle, Steve Gray, and colleagues at the University of Wyoming conducted a research effort to collect new chronologies in the Wind River basin and generate streamflow reconstructions for several gages. Their work resulted in three reconstructions of annual (water-year) streamflow, two of which are archived in TreeFlow: the Wind River near Dubois, WY, and the Little Popo Agie River near Lander, WY.
Note: The reconstruction shown below is different than the models described in Barnett et al. (2009), but the gage data, tree-ring data, and methods used are as described in that paper.
References:
Watson, T. A., F. A. Barnett, S. T. Gray, and G. A. Tootle. 2009. Reconstructed Streamflows for the Headwaters of the Wind River, Wyoming, United States. Journal of the American Water Resources Association 45(1):224-236.
Methods
A forward stepwise linear regression procedure was used to calibrate the observed flow record with a pool of potential predictors consisting of tree-ring chronologies from Wyoming, Colorado, Montana, and Utah that were pre-screened for significant (at >99%) relationships with the observed record. The residual chronologies, with the low-order autocorrelation removed, were used. Three predictor chronologies were selected by the stepwise procedure for the reconstruction model. Validation statistics were computed using a leave-one-out (cross-validation) approach.
Predictors: Fremont Lake (WY), Clarks Fork of the Yellowstone (WY), Green Mountain Reservoir (CO)
| Statistic | Calibration | Validation |
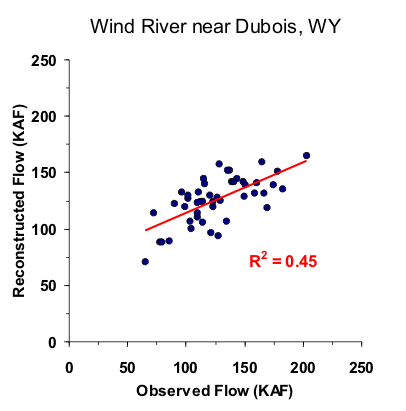
| Explained variance (R2) | 0.45 | |
| Reduction of Error (RE) | 0.36 | |
| Standard Error of the Estimate | 23,599 AF | |
| Root Mean Square Error (RMSE) | 24,350 AF |
(For explanations of these statistics, see this document (PDF), and also the Reconstruction Case Study page.)

Figure 1. Scatter plot of observed and reconstructed Wind River annual flow, 1946-1992.

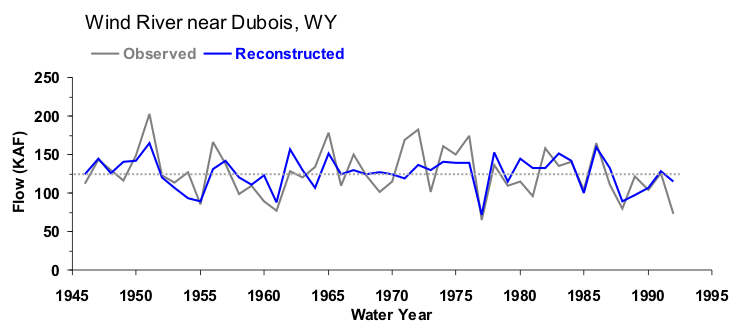
Figure 2. Observed (black) and reconstructed (blue) annual Wind River annual flow, 1946-1992. The observed mean is shown by the dashed line.

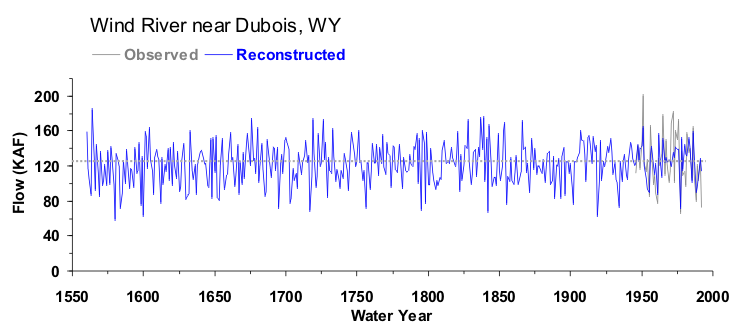
Figure 3. Reconstructed annual flow for the Wind River (1560-1992) is shown in blue. Observed flow is shown in gray and the long-term reconstructed mean is shown by the dashed line.

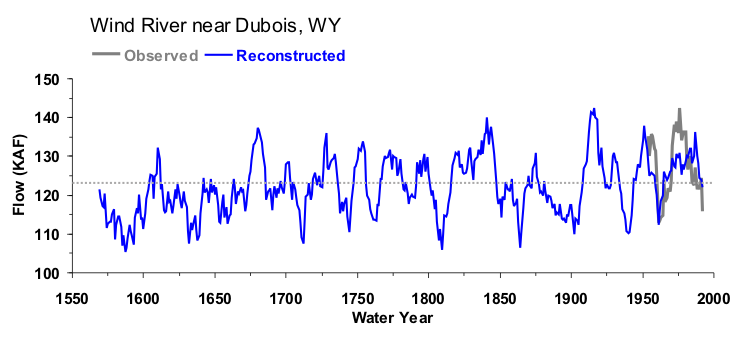
Figure 4. The 10-year running mean (plotted on final year) of reconstructed Wind River flow, 1560-1992. Reconstructed values are shown in blue and observed values are shown in gray. The long-term reconstructed mean is shown by the dashed line.


